
 Sprache zu Deutsch wechseln
  Continue in English
 Overview Maps
On this page we offer you some of our maps from GeotIS as overview maps for download.
WMS/ Shapefiles
The geothermal locations are also available as Web Map Service (WMS), the maps of the geothermal atlas are available as shapefiles and as WMS.
You are welcome to use both variants to integrate the data into your own applications, please note our Terms of Use.
More information: WMS.
Map of geothermal locations
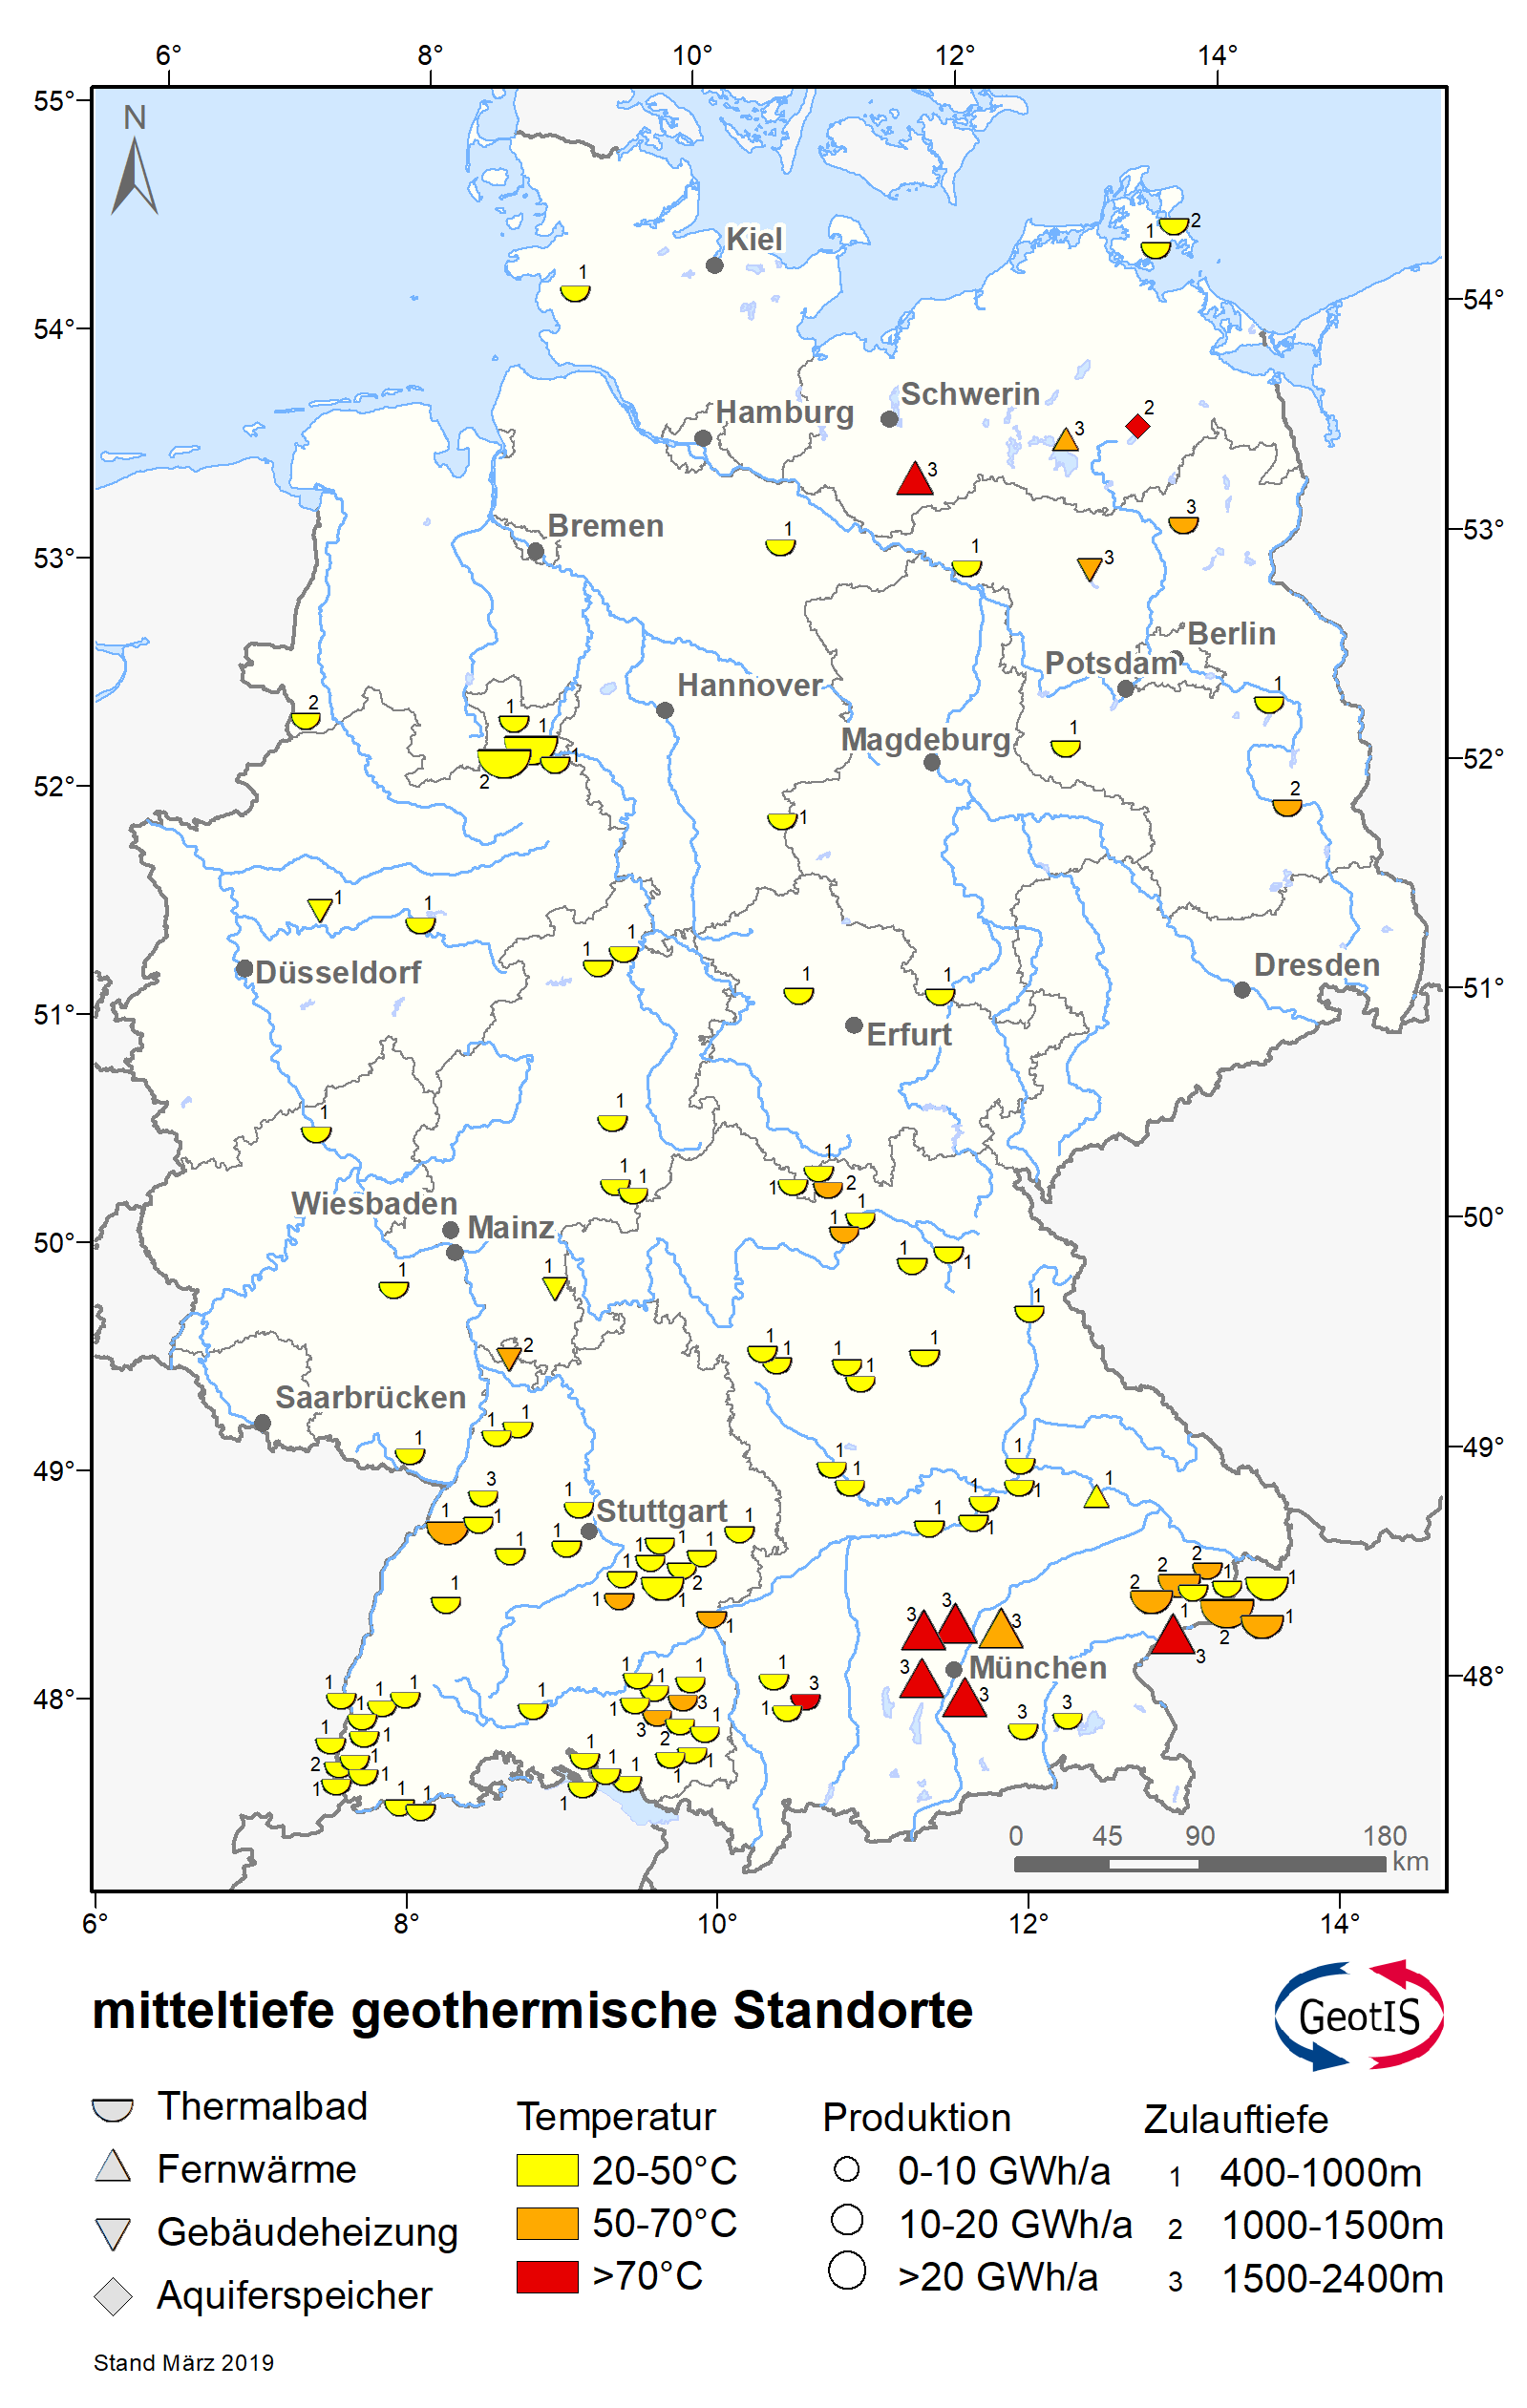
The map shows medium-deep geothermal locations with type of use, temperature, production and inflow depth.
The current locations data are also available as a Web Map Service (WMS), information on this under WMS.
Geothermal atlas
Geothermal atlas to show possible competing uses between CCS and deep geothermal energy
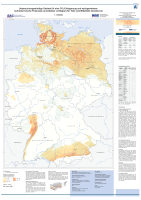
Map A: Investigative areas for CO₂ storage and proven hydrothermal potentials (available immediately) for deep and mid-depth geothermal energy
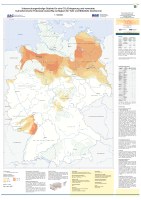
Map B: Areas worth investigating for CO₂ storage and assumed hydrothermal potentials (available in the future) for deep and medium-depth geothermal energy
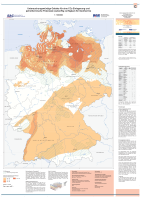
Map C: Areas worth investigating for CO₂ storage and petrothermal potentials (available in the future) for geothermal energy
Map D: Areas worth investigating for CO₂ storage and all hydrothermal and petrothermal potentials (compilation of maps A-C) for geothermal energy
Download all maps: Geothermieatlas_PDF.zip | Geothermieatlas_Shape.zip
The geothermal atlas is also available as a web map service (WMS), more information under WMS.
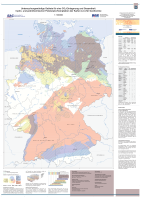
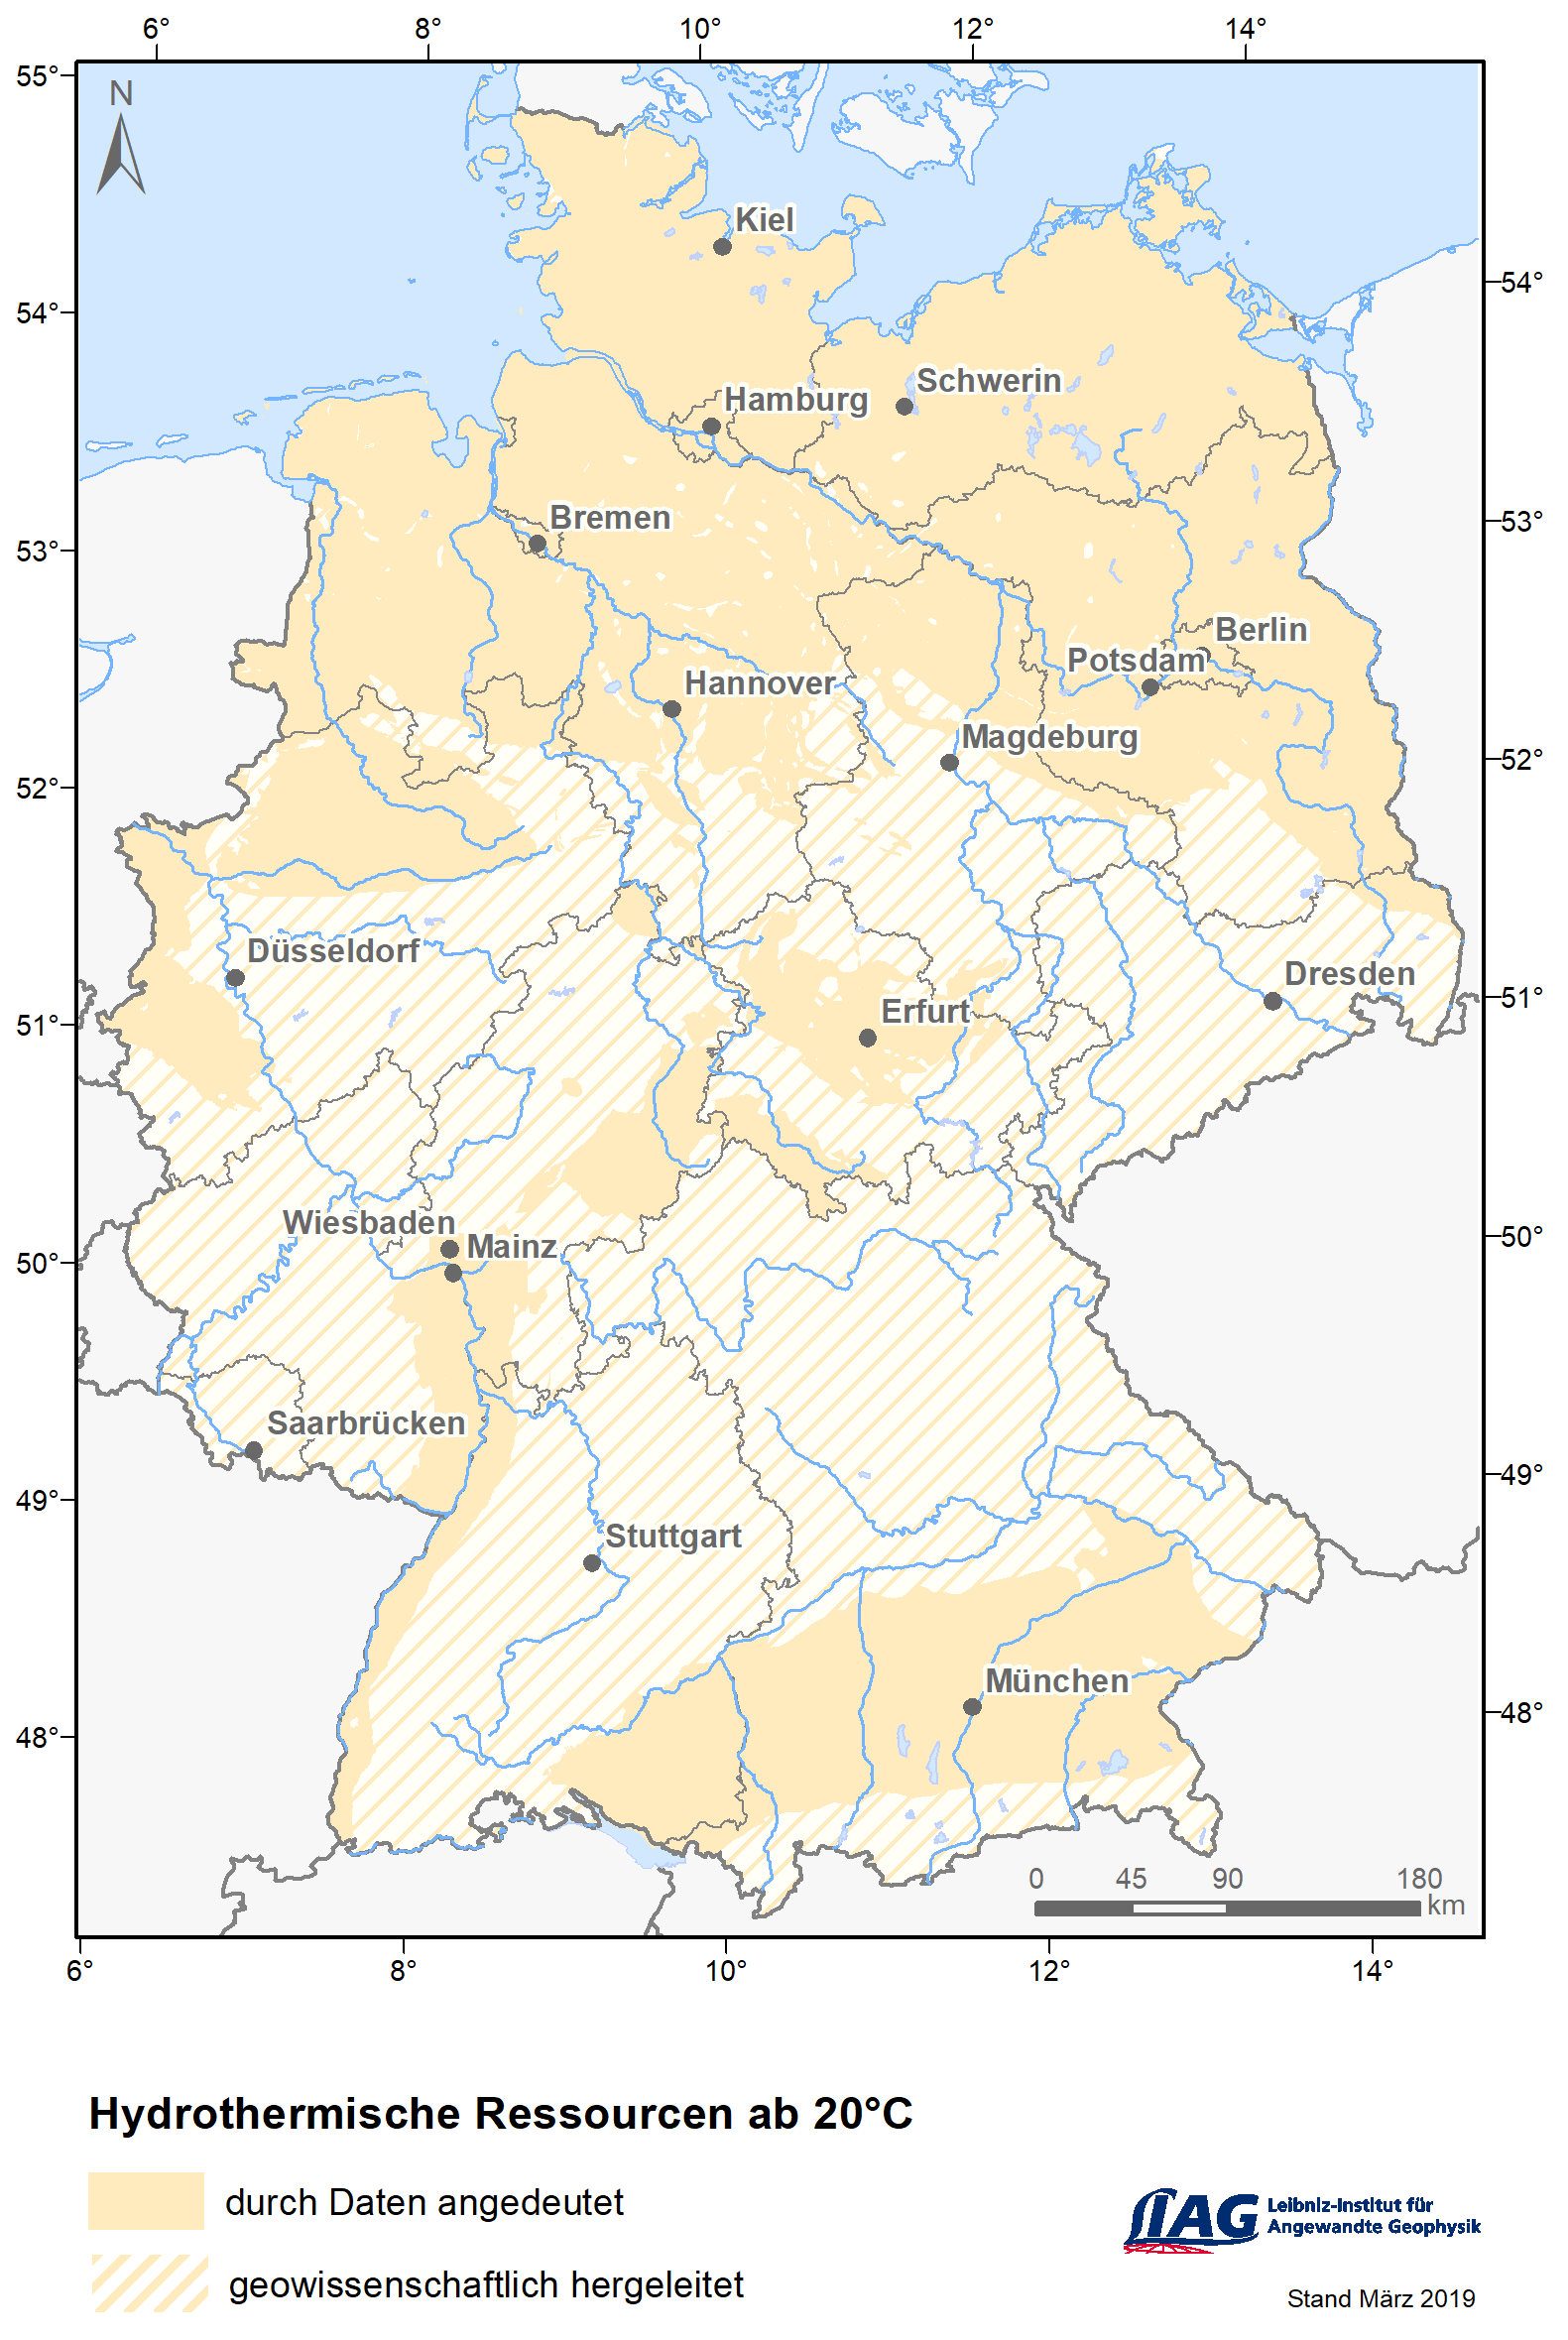
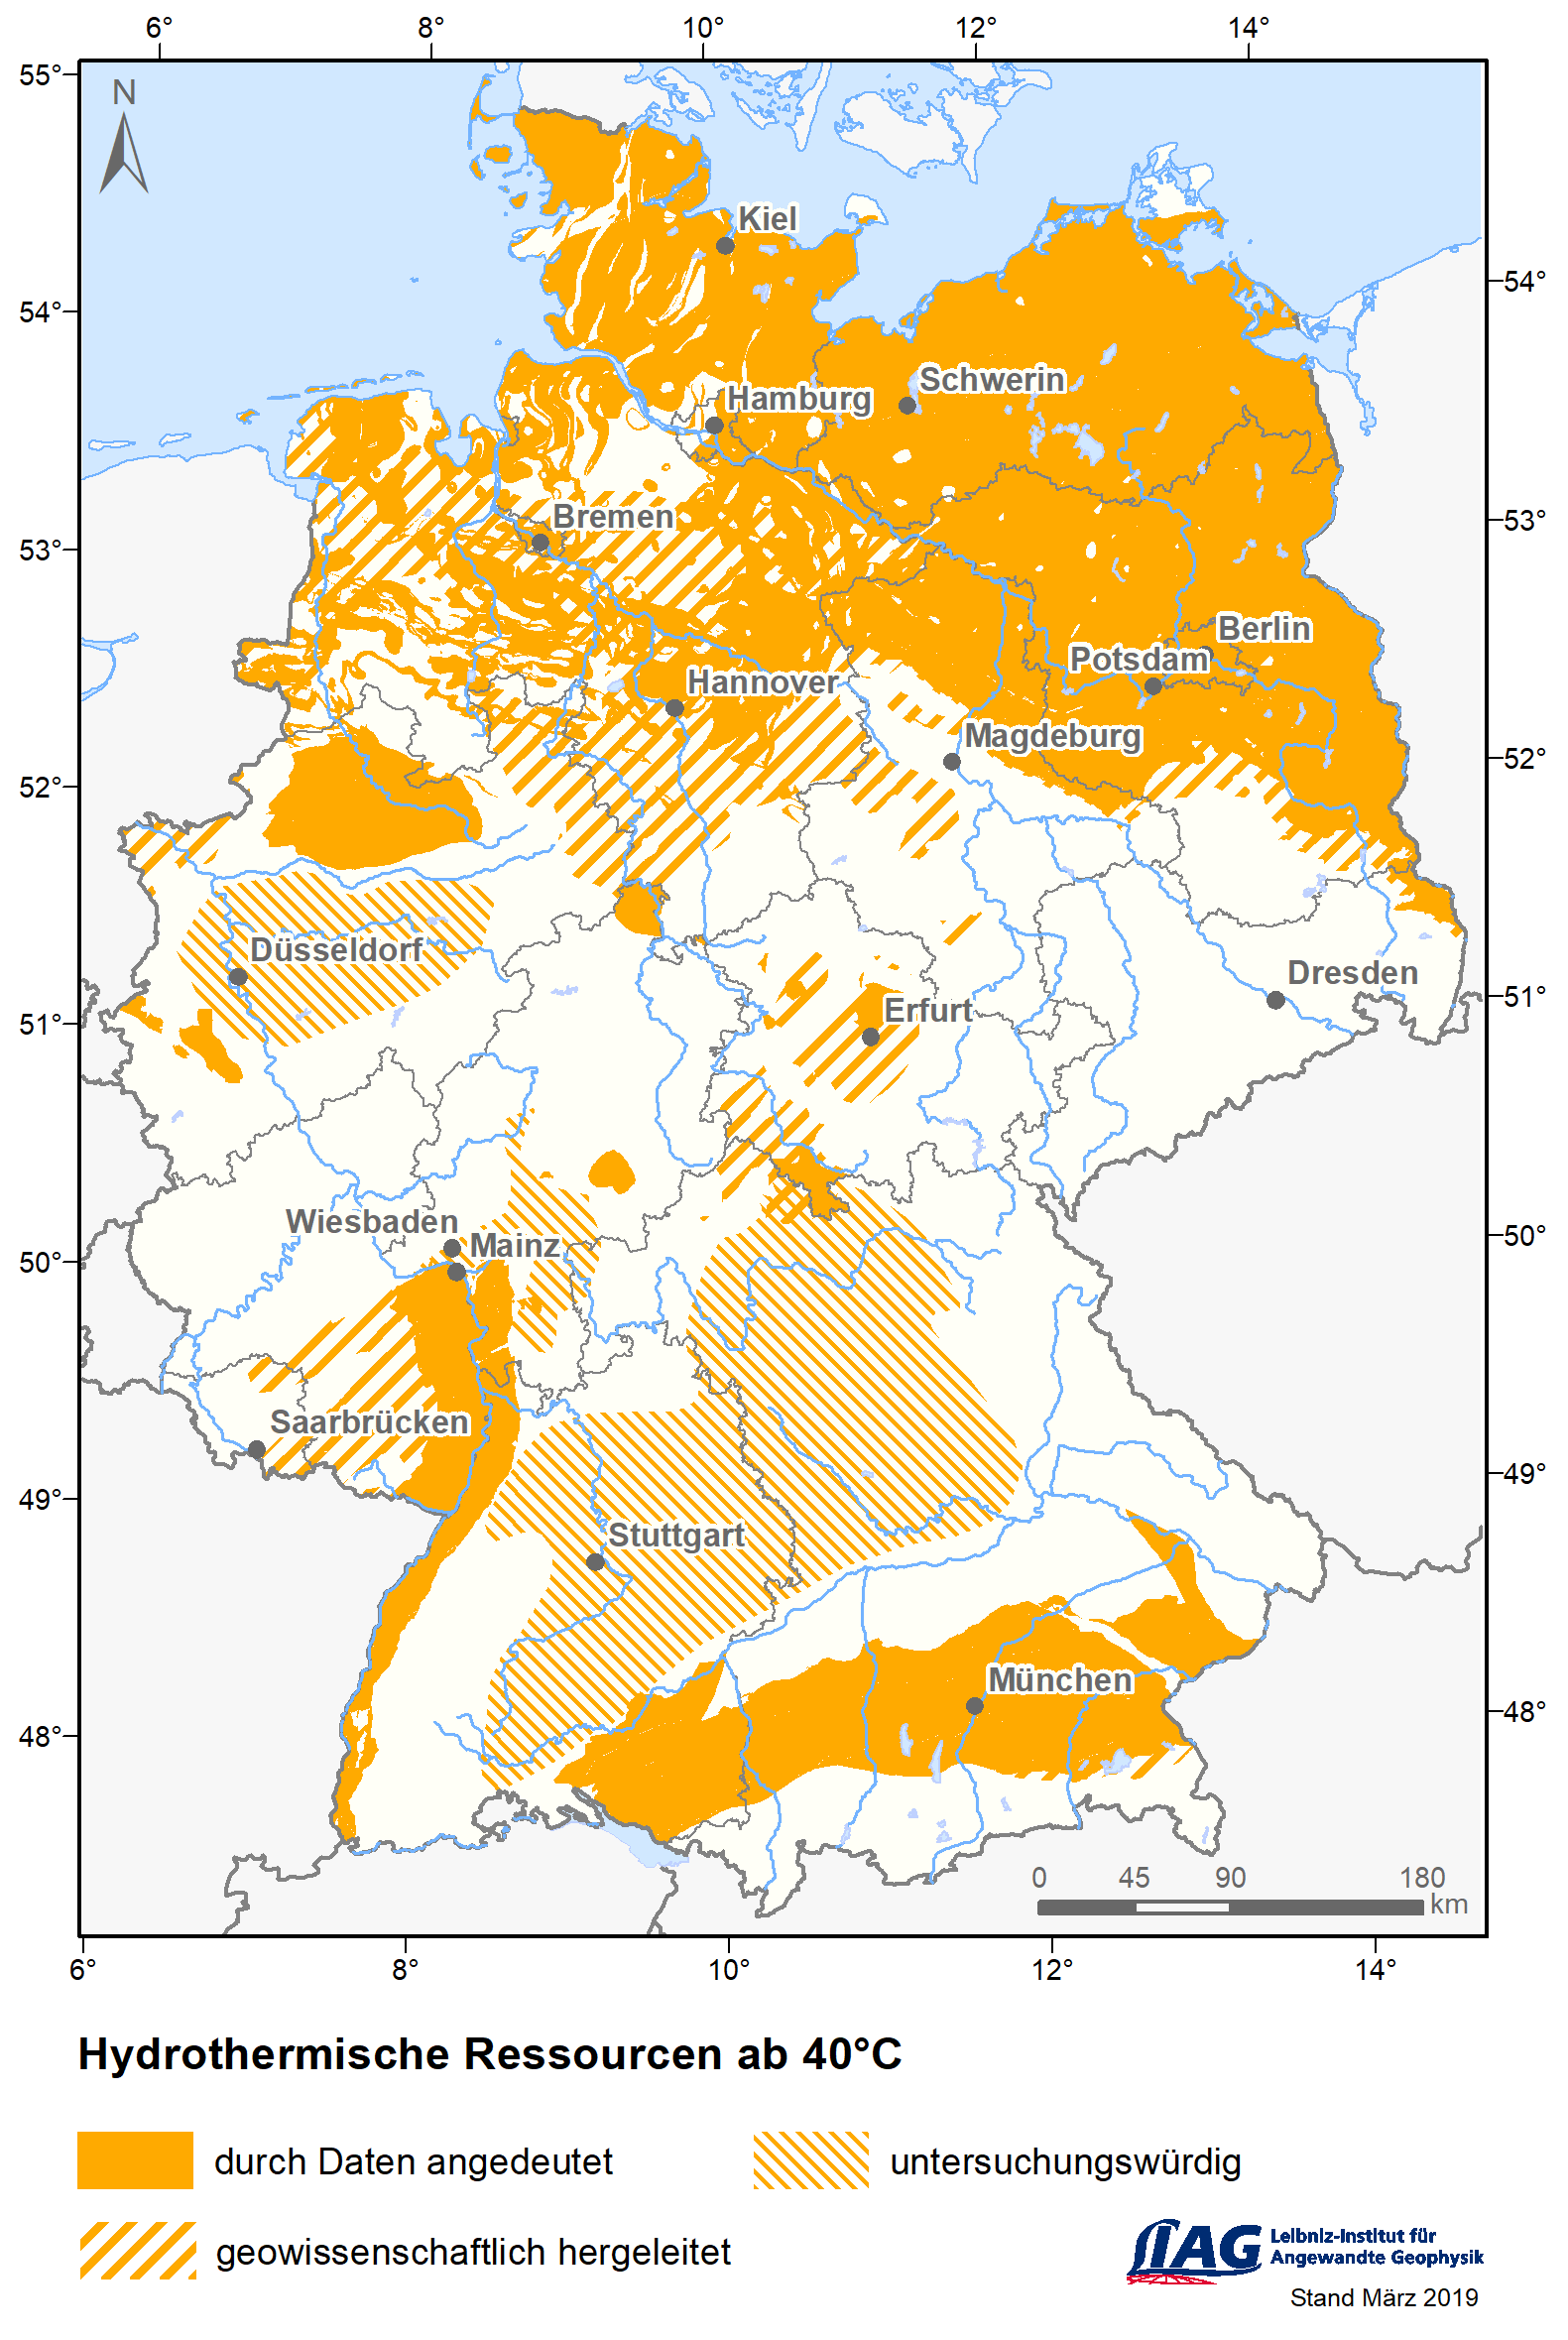
Hydrothermal resources for different temperature levels
Maps of geothermal resources in Germany at different temperature levels - using data from the Geothermal Atlas (see above).
Resource map 20 °C
Resource map 40 °C
Resource map 60 °C
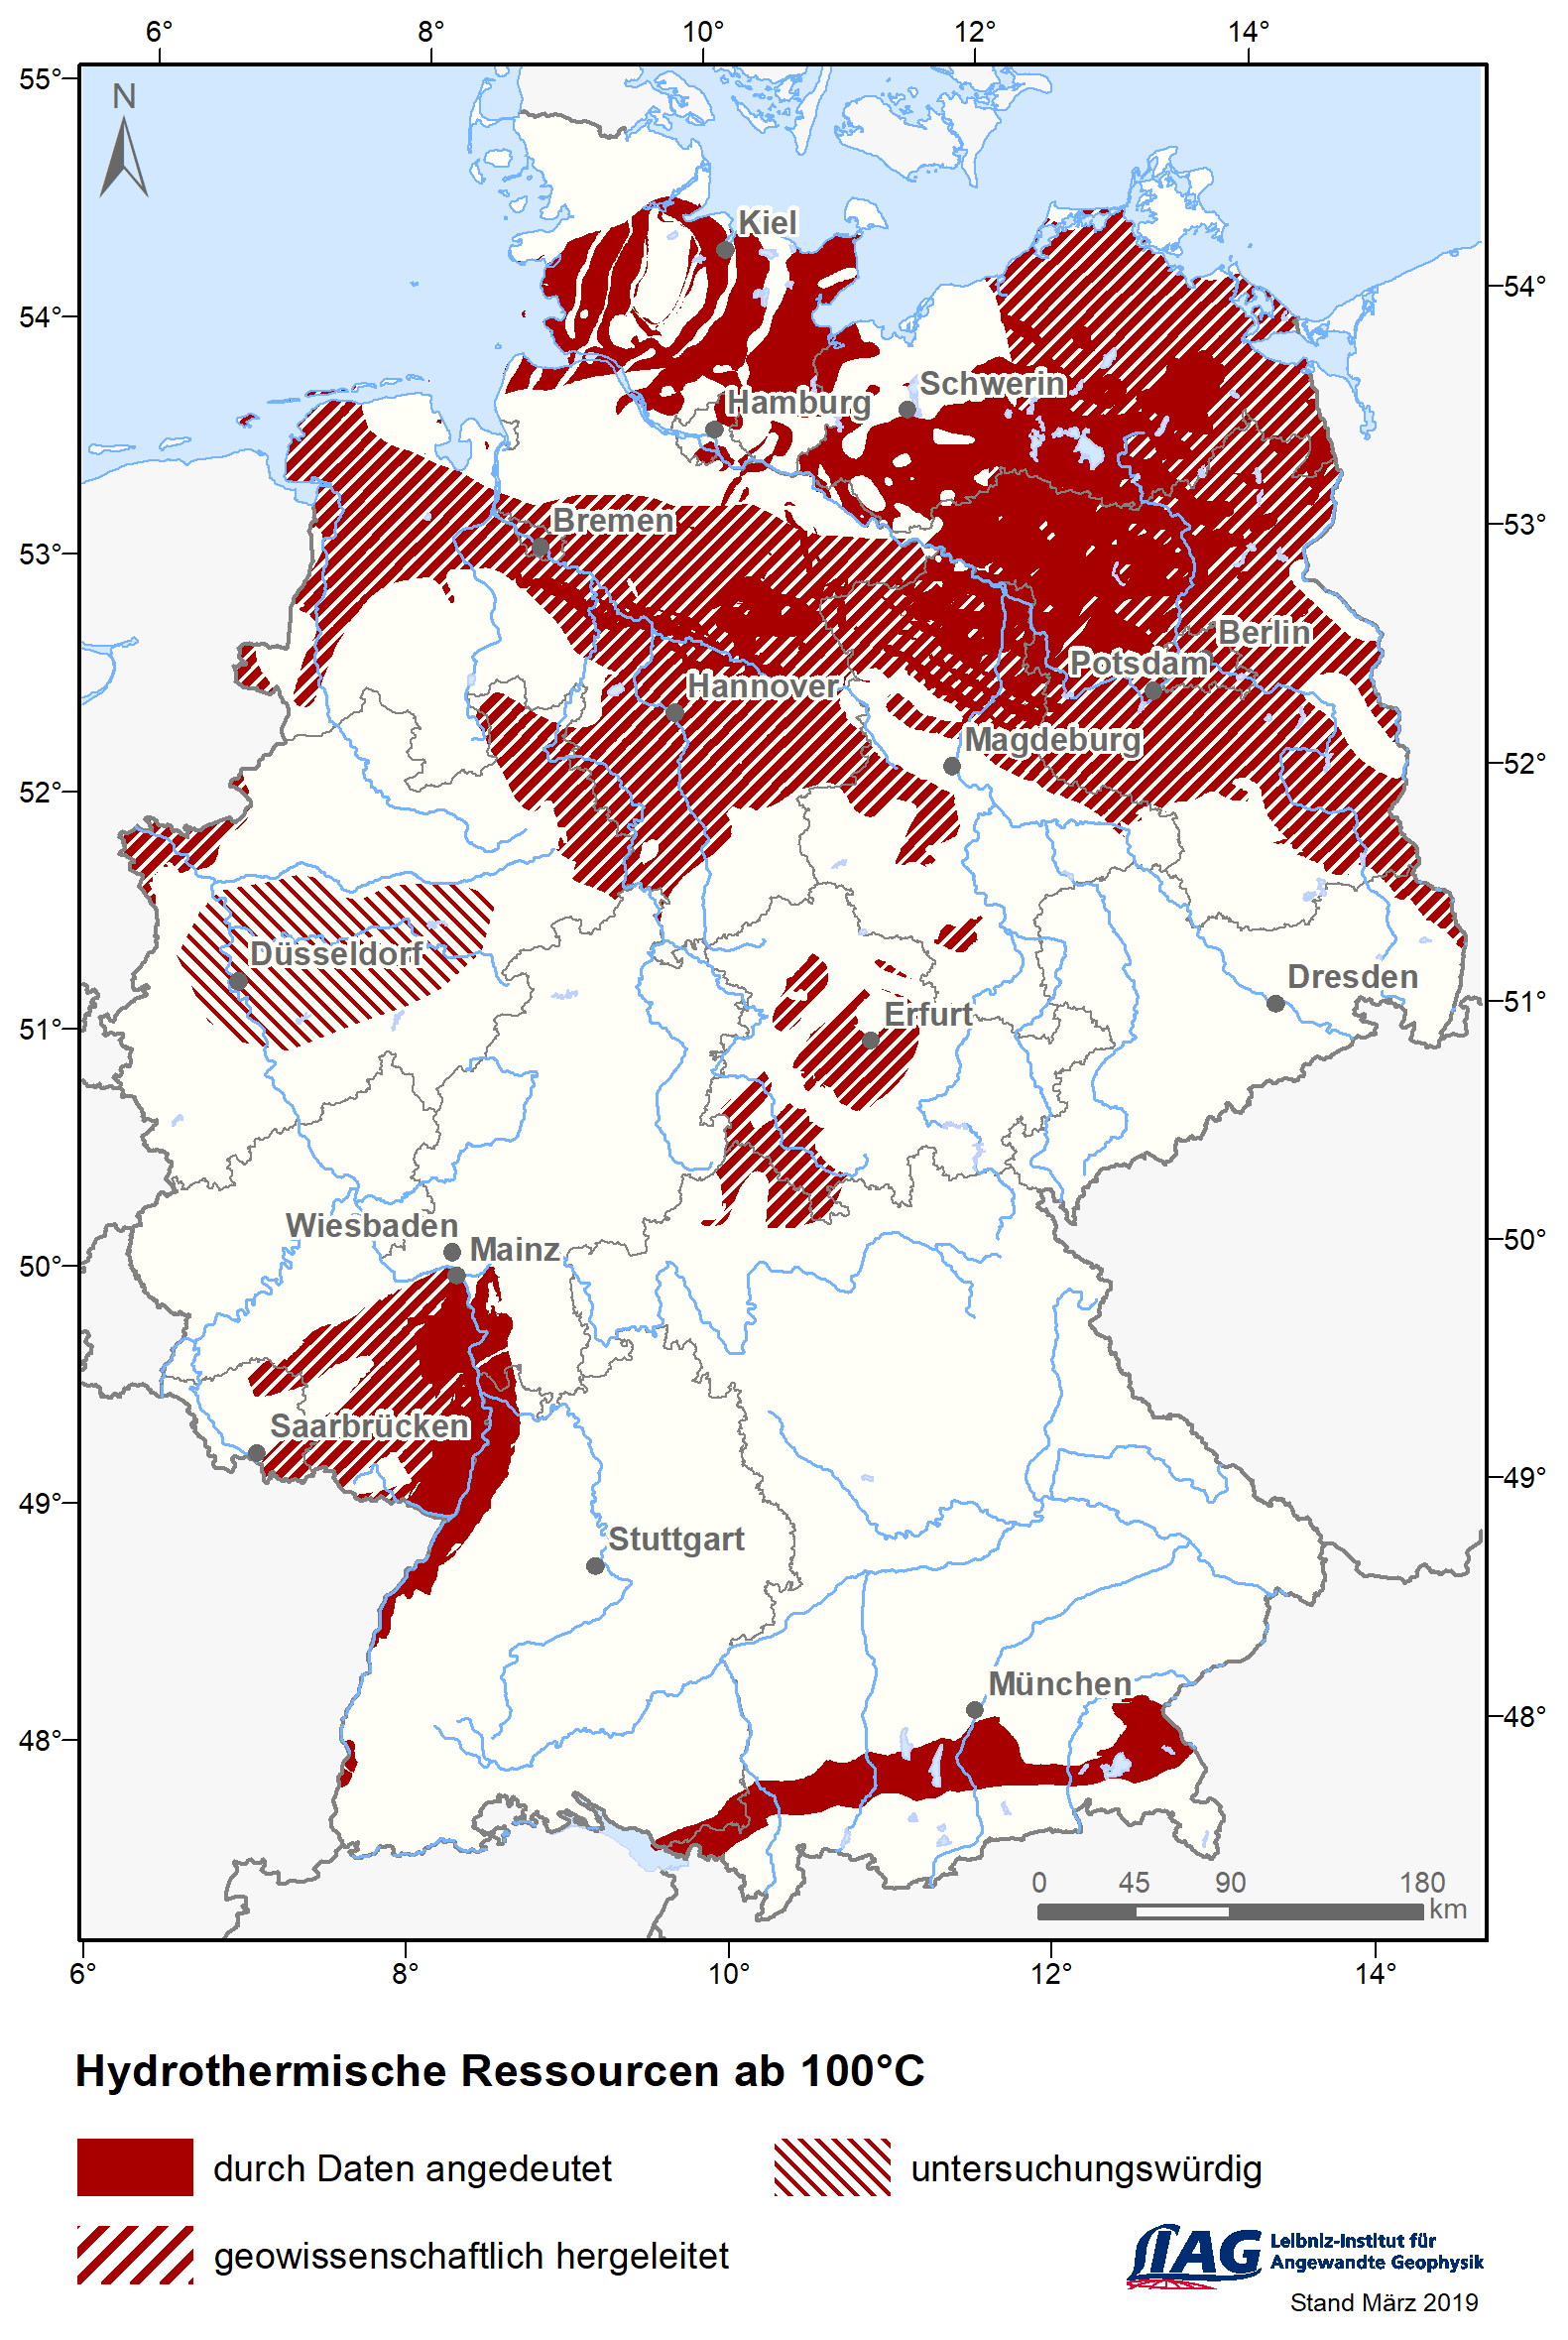
Resource map 100 °C
Download all maps: Ressourcenkarten.zip
From: The role of deep geothermal energy in the heat transition.(AGEMAR, T., SUCHI, E., MOECK, I. (2018))
Subsurface Temperature Maps
Display of the subsurface temperatures for different depths below sea level. Due to the non-uniform data availability, the temperature determined is subject to great uncertainty in some regions.
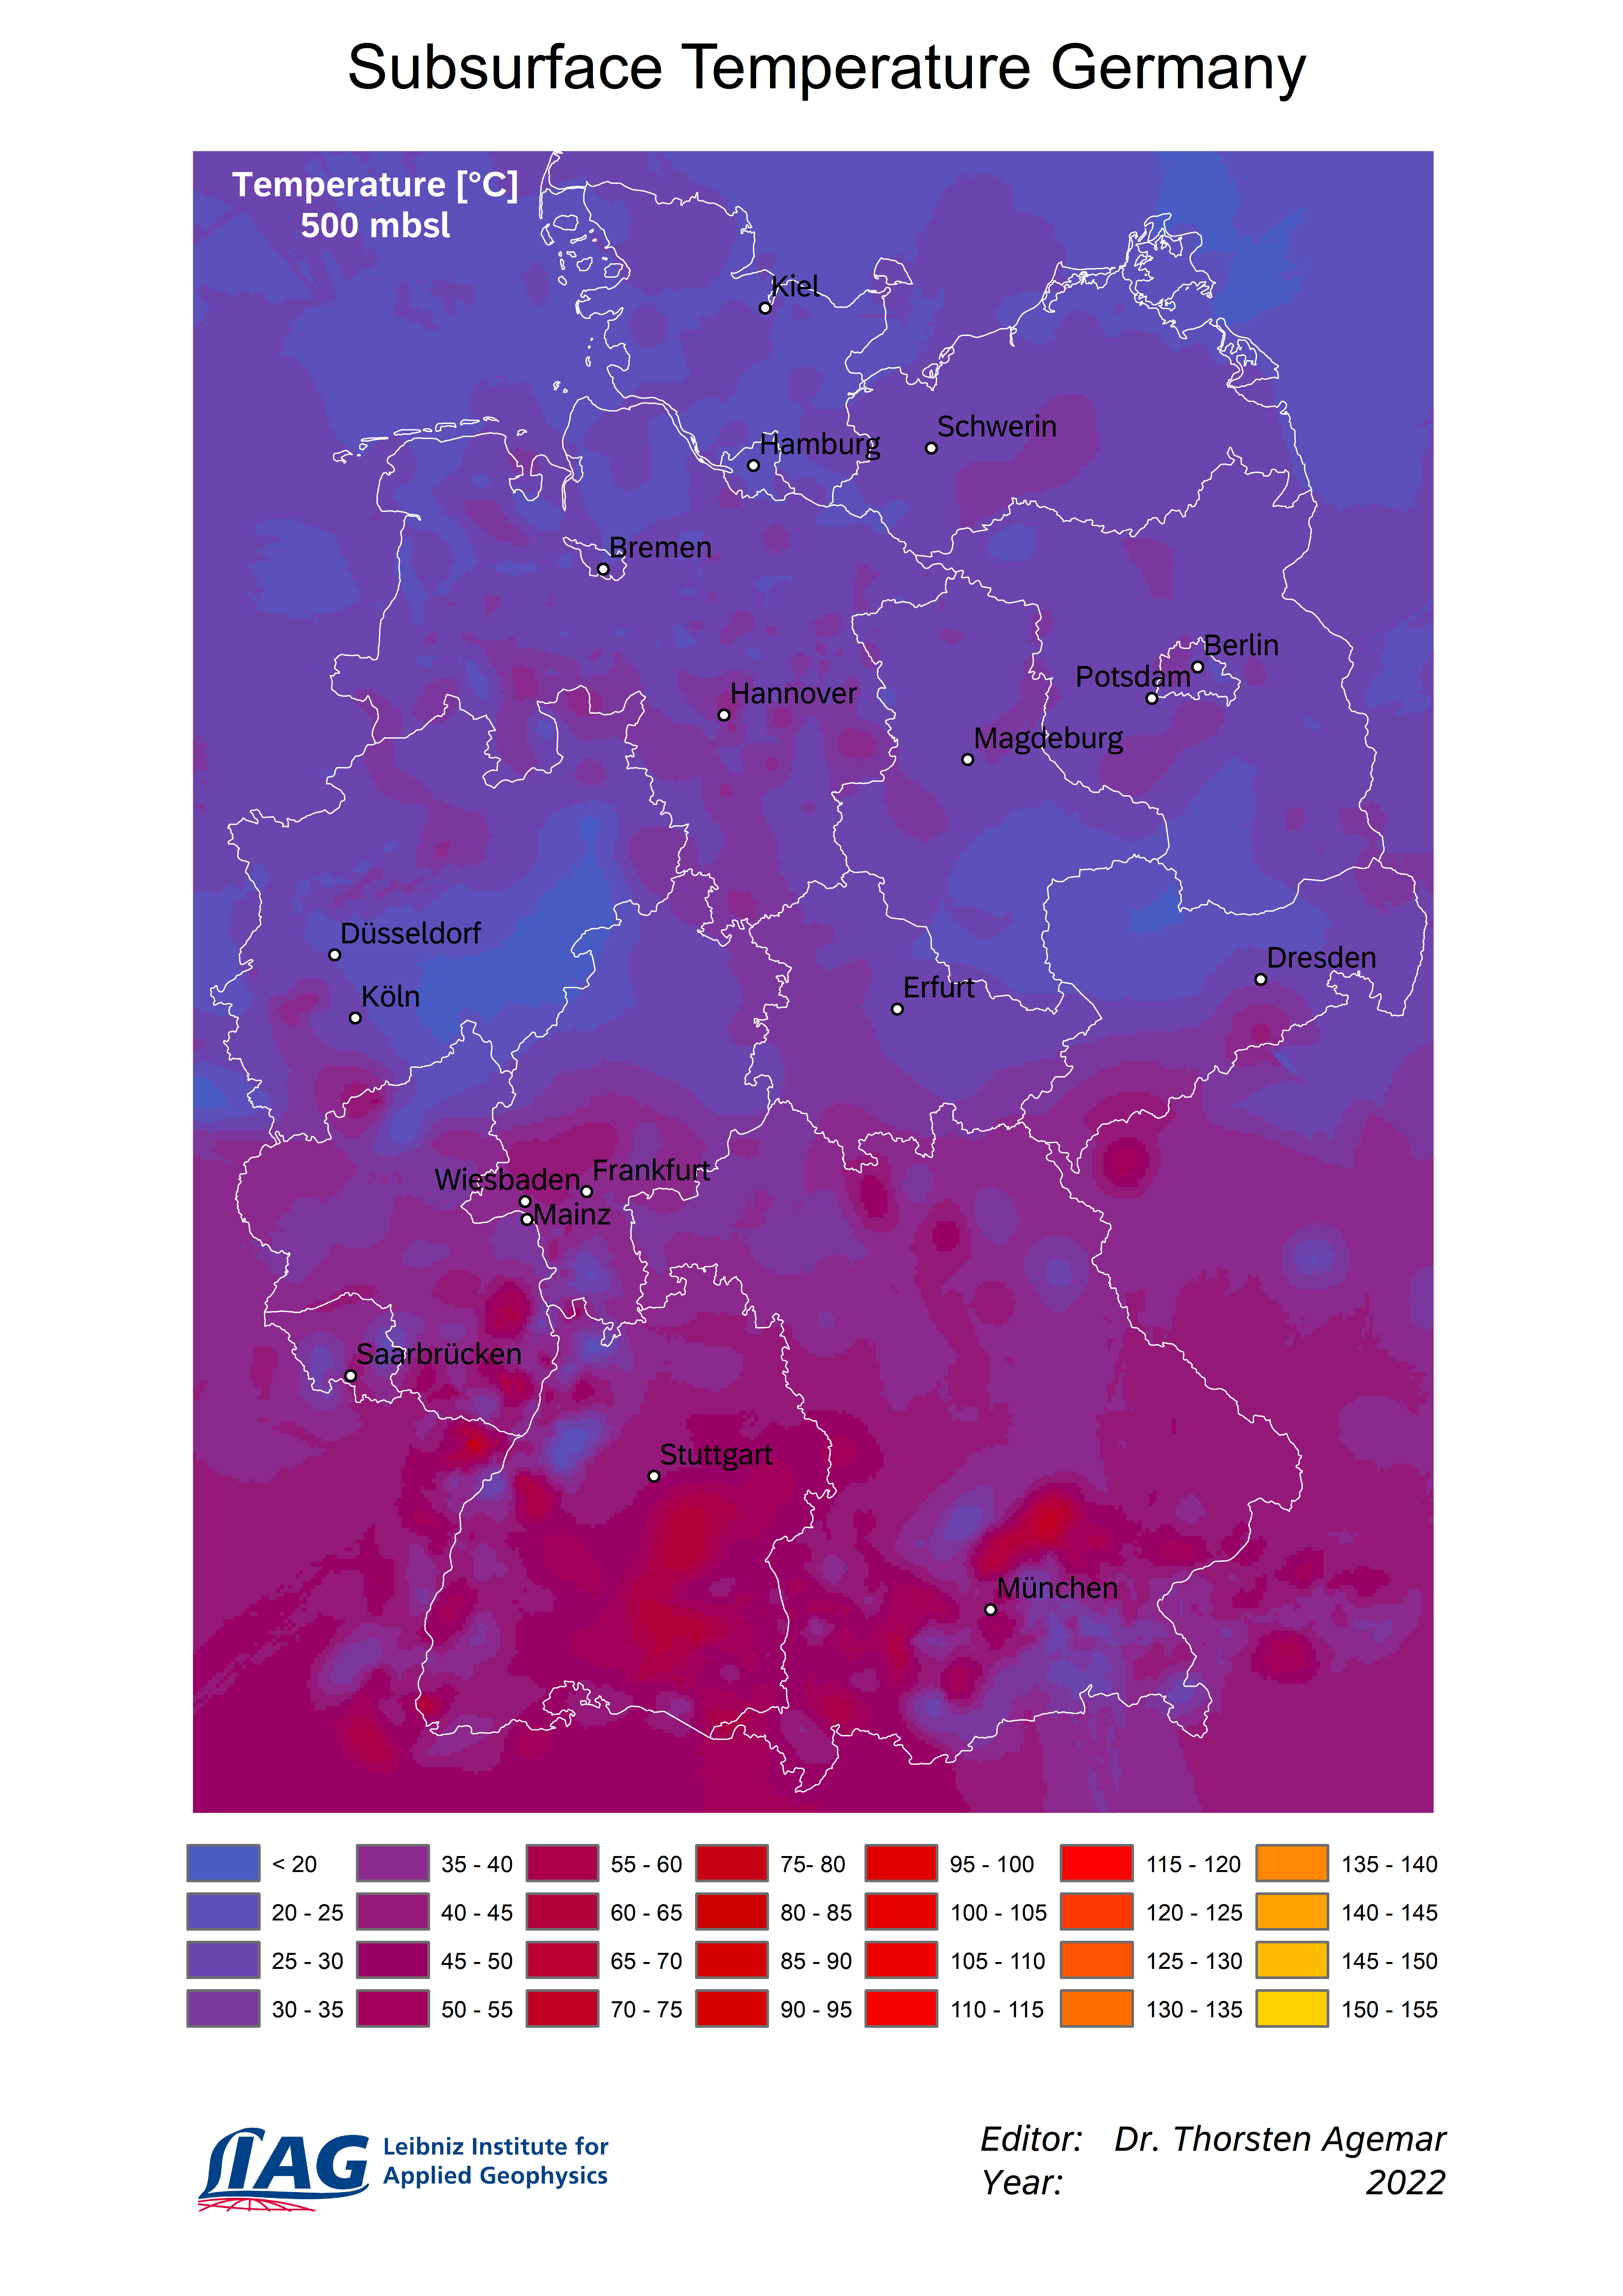
Temperature at -500m NN
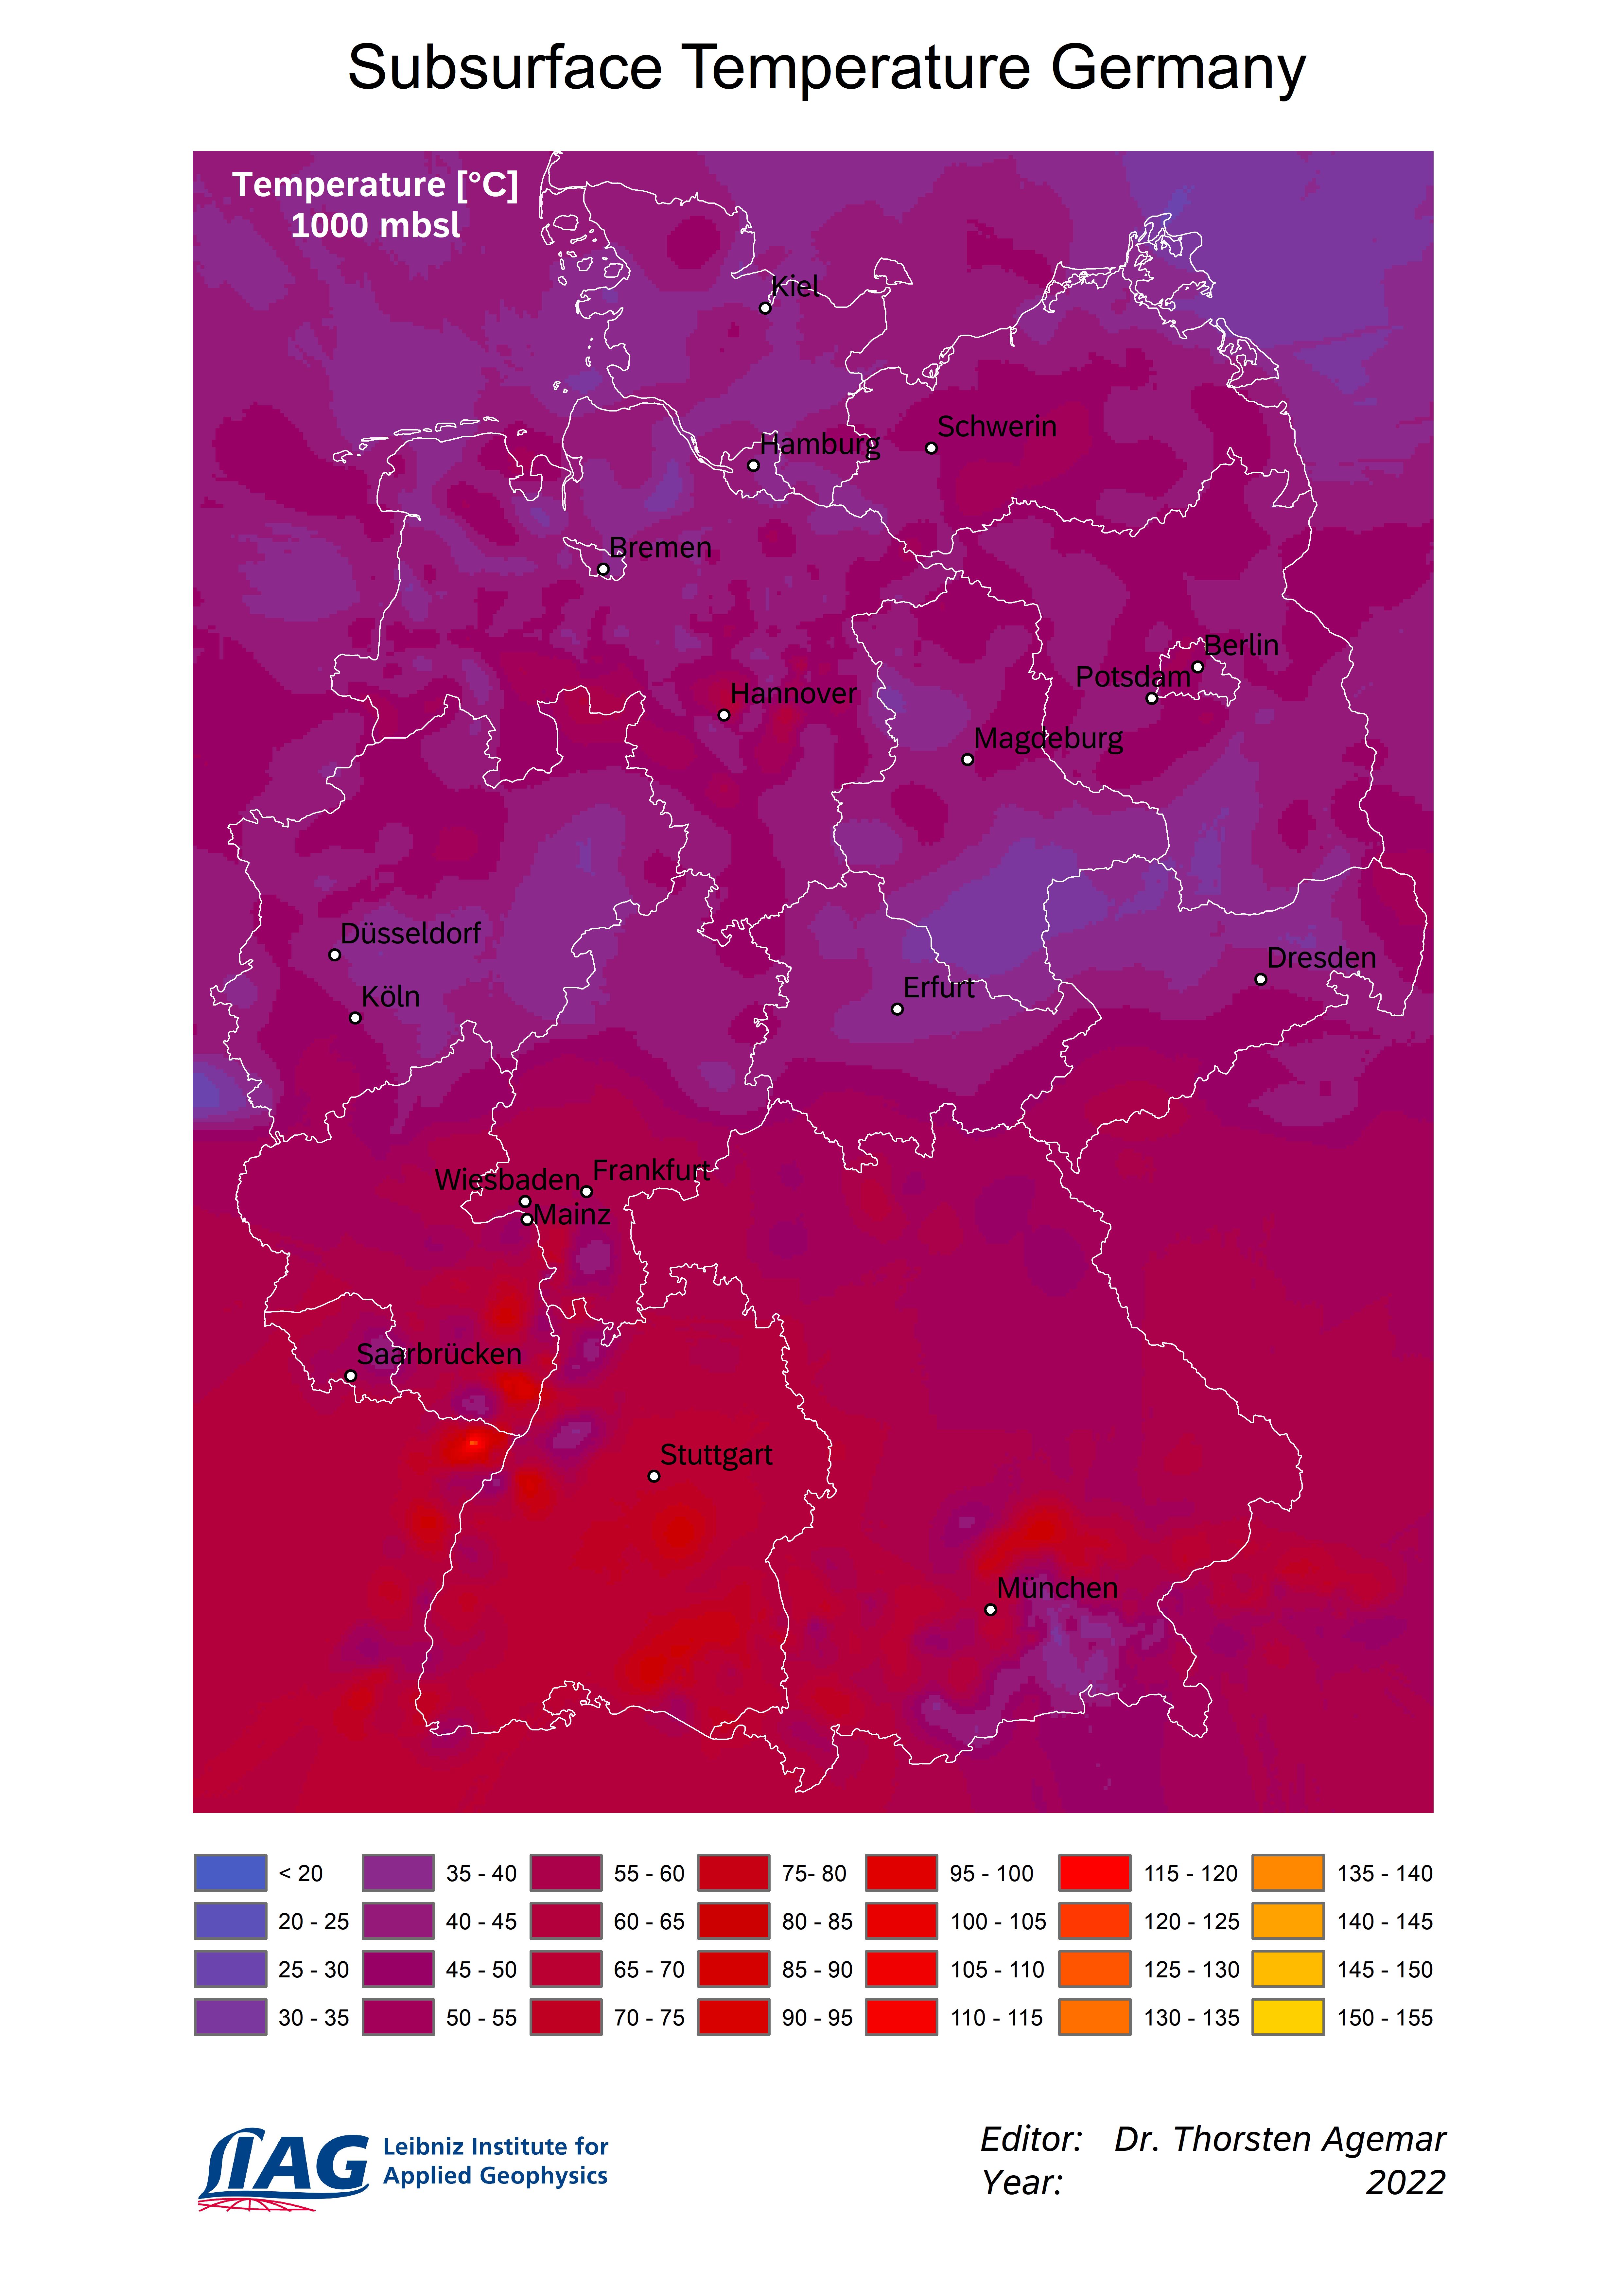
Temperature at -1000m NN
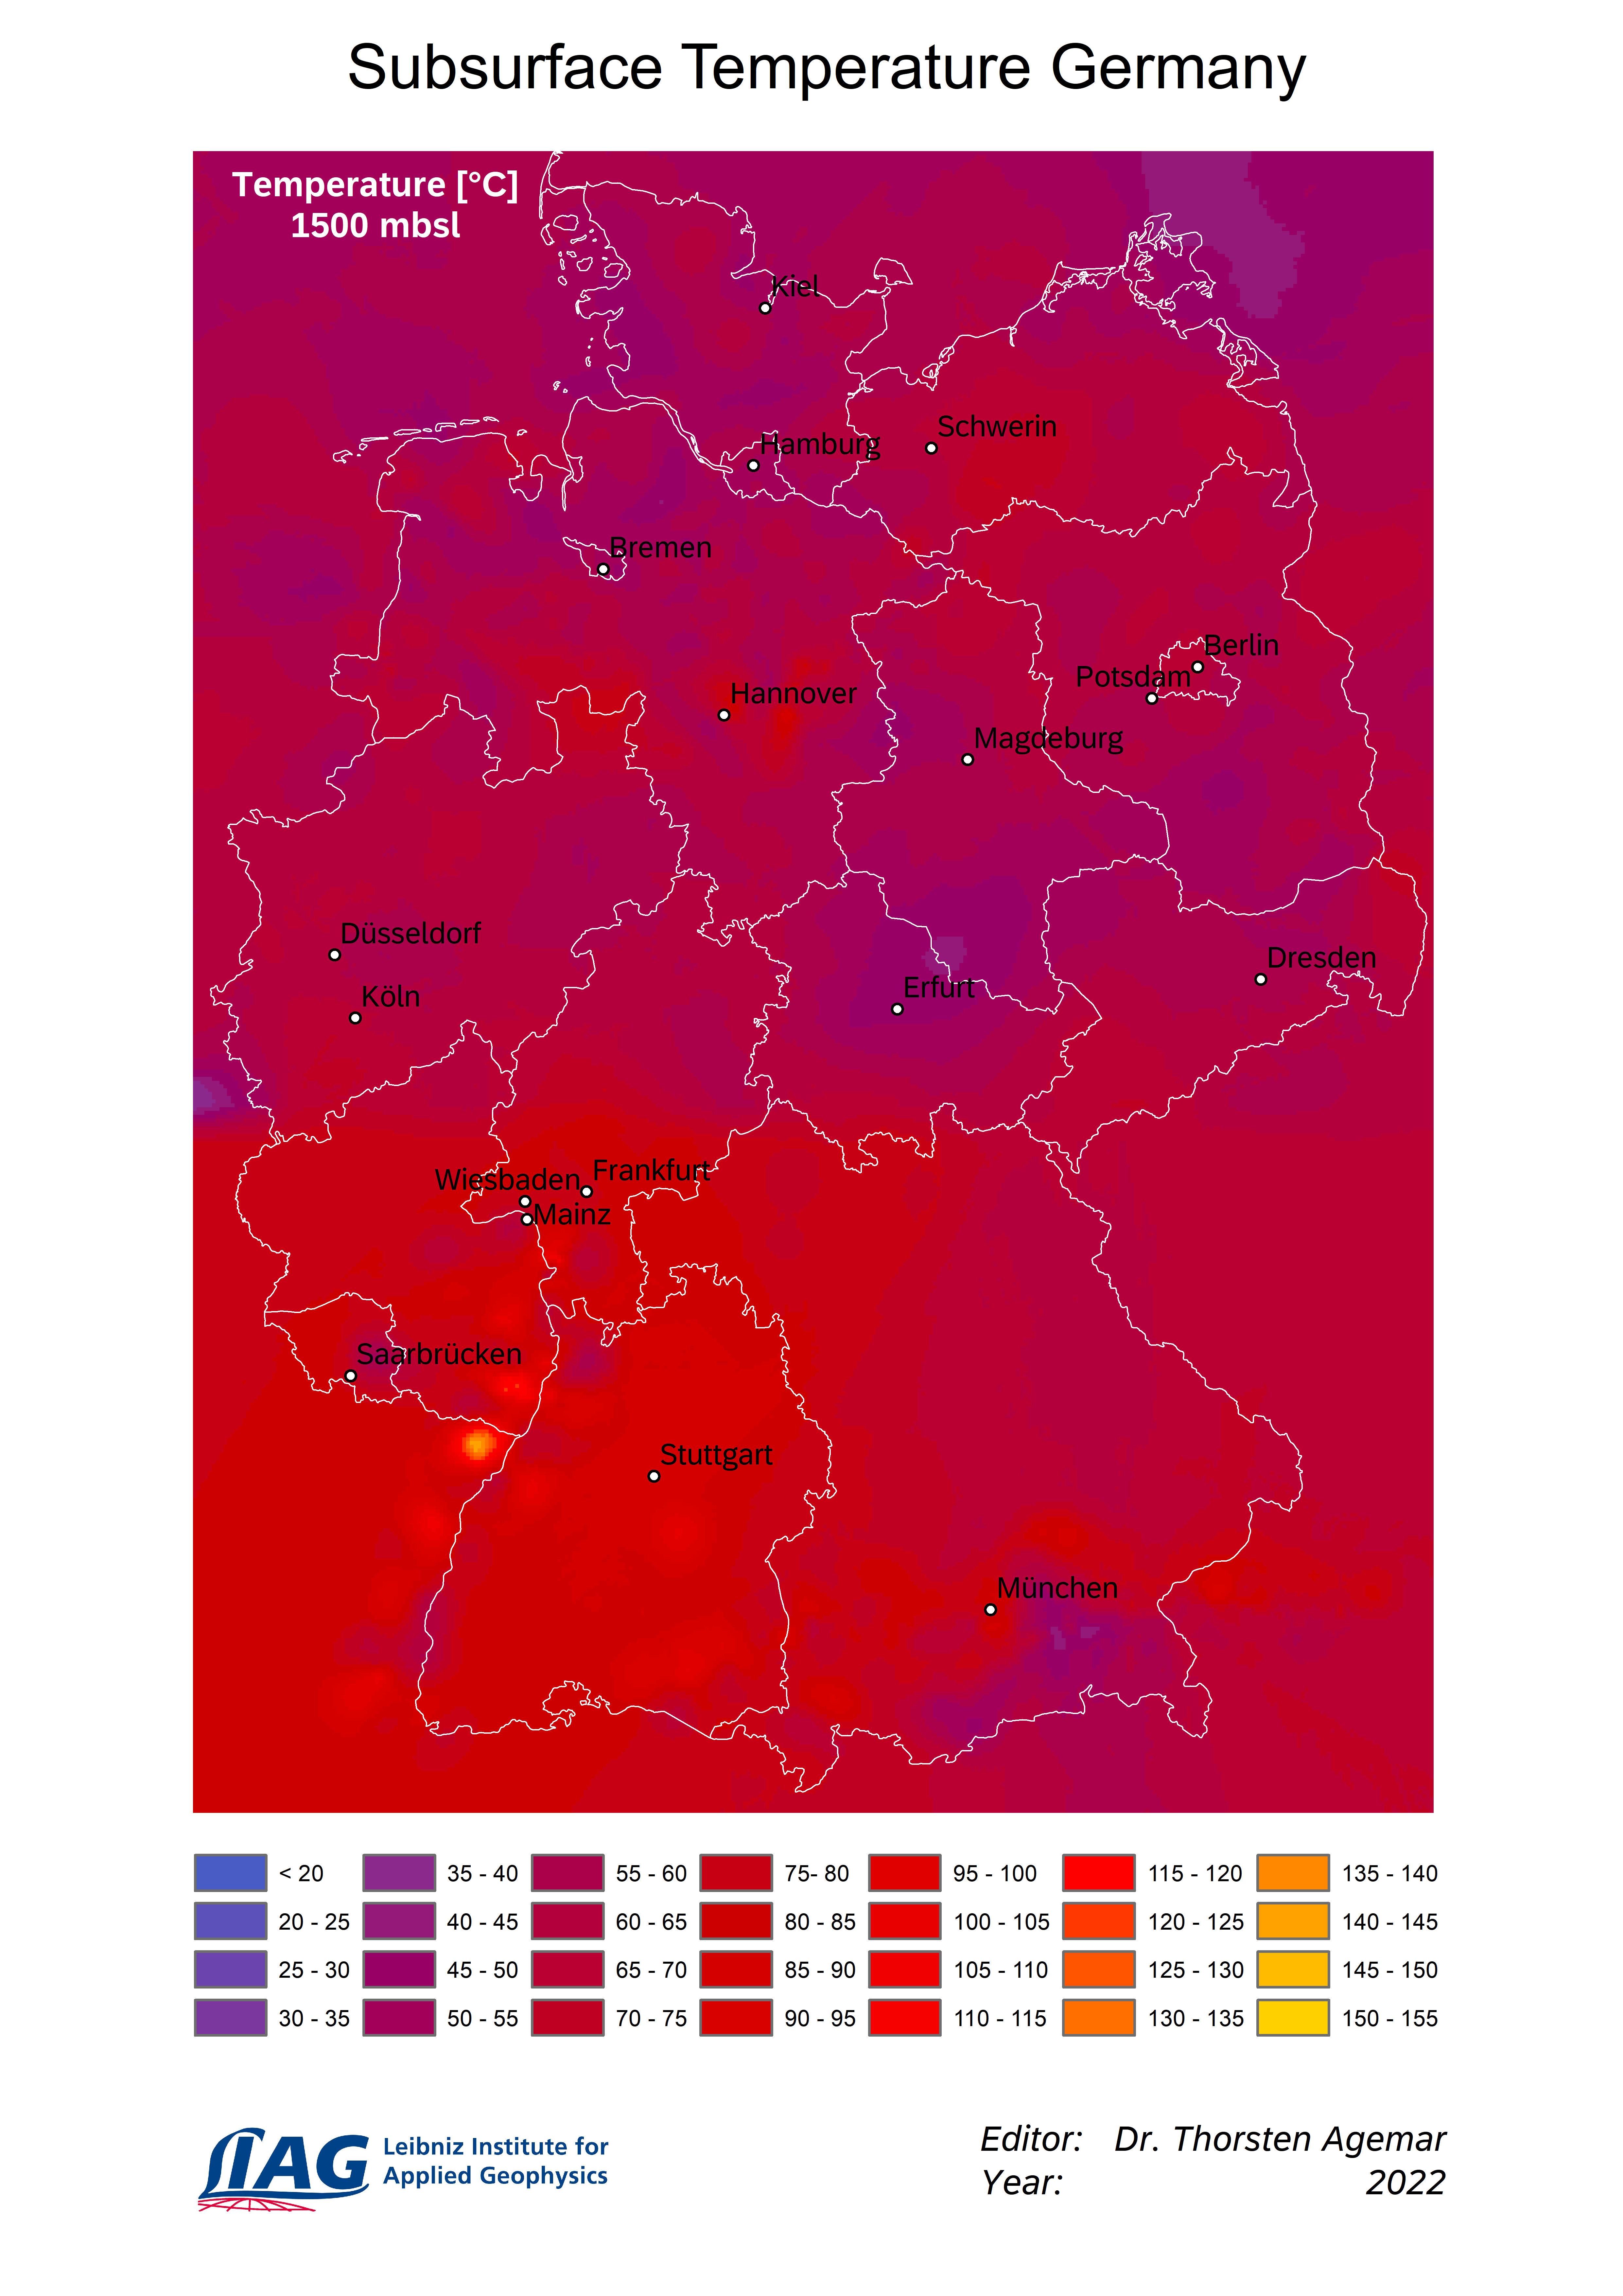
Temperature at -1500m NN
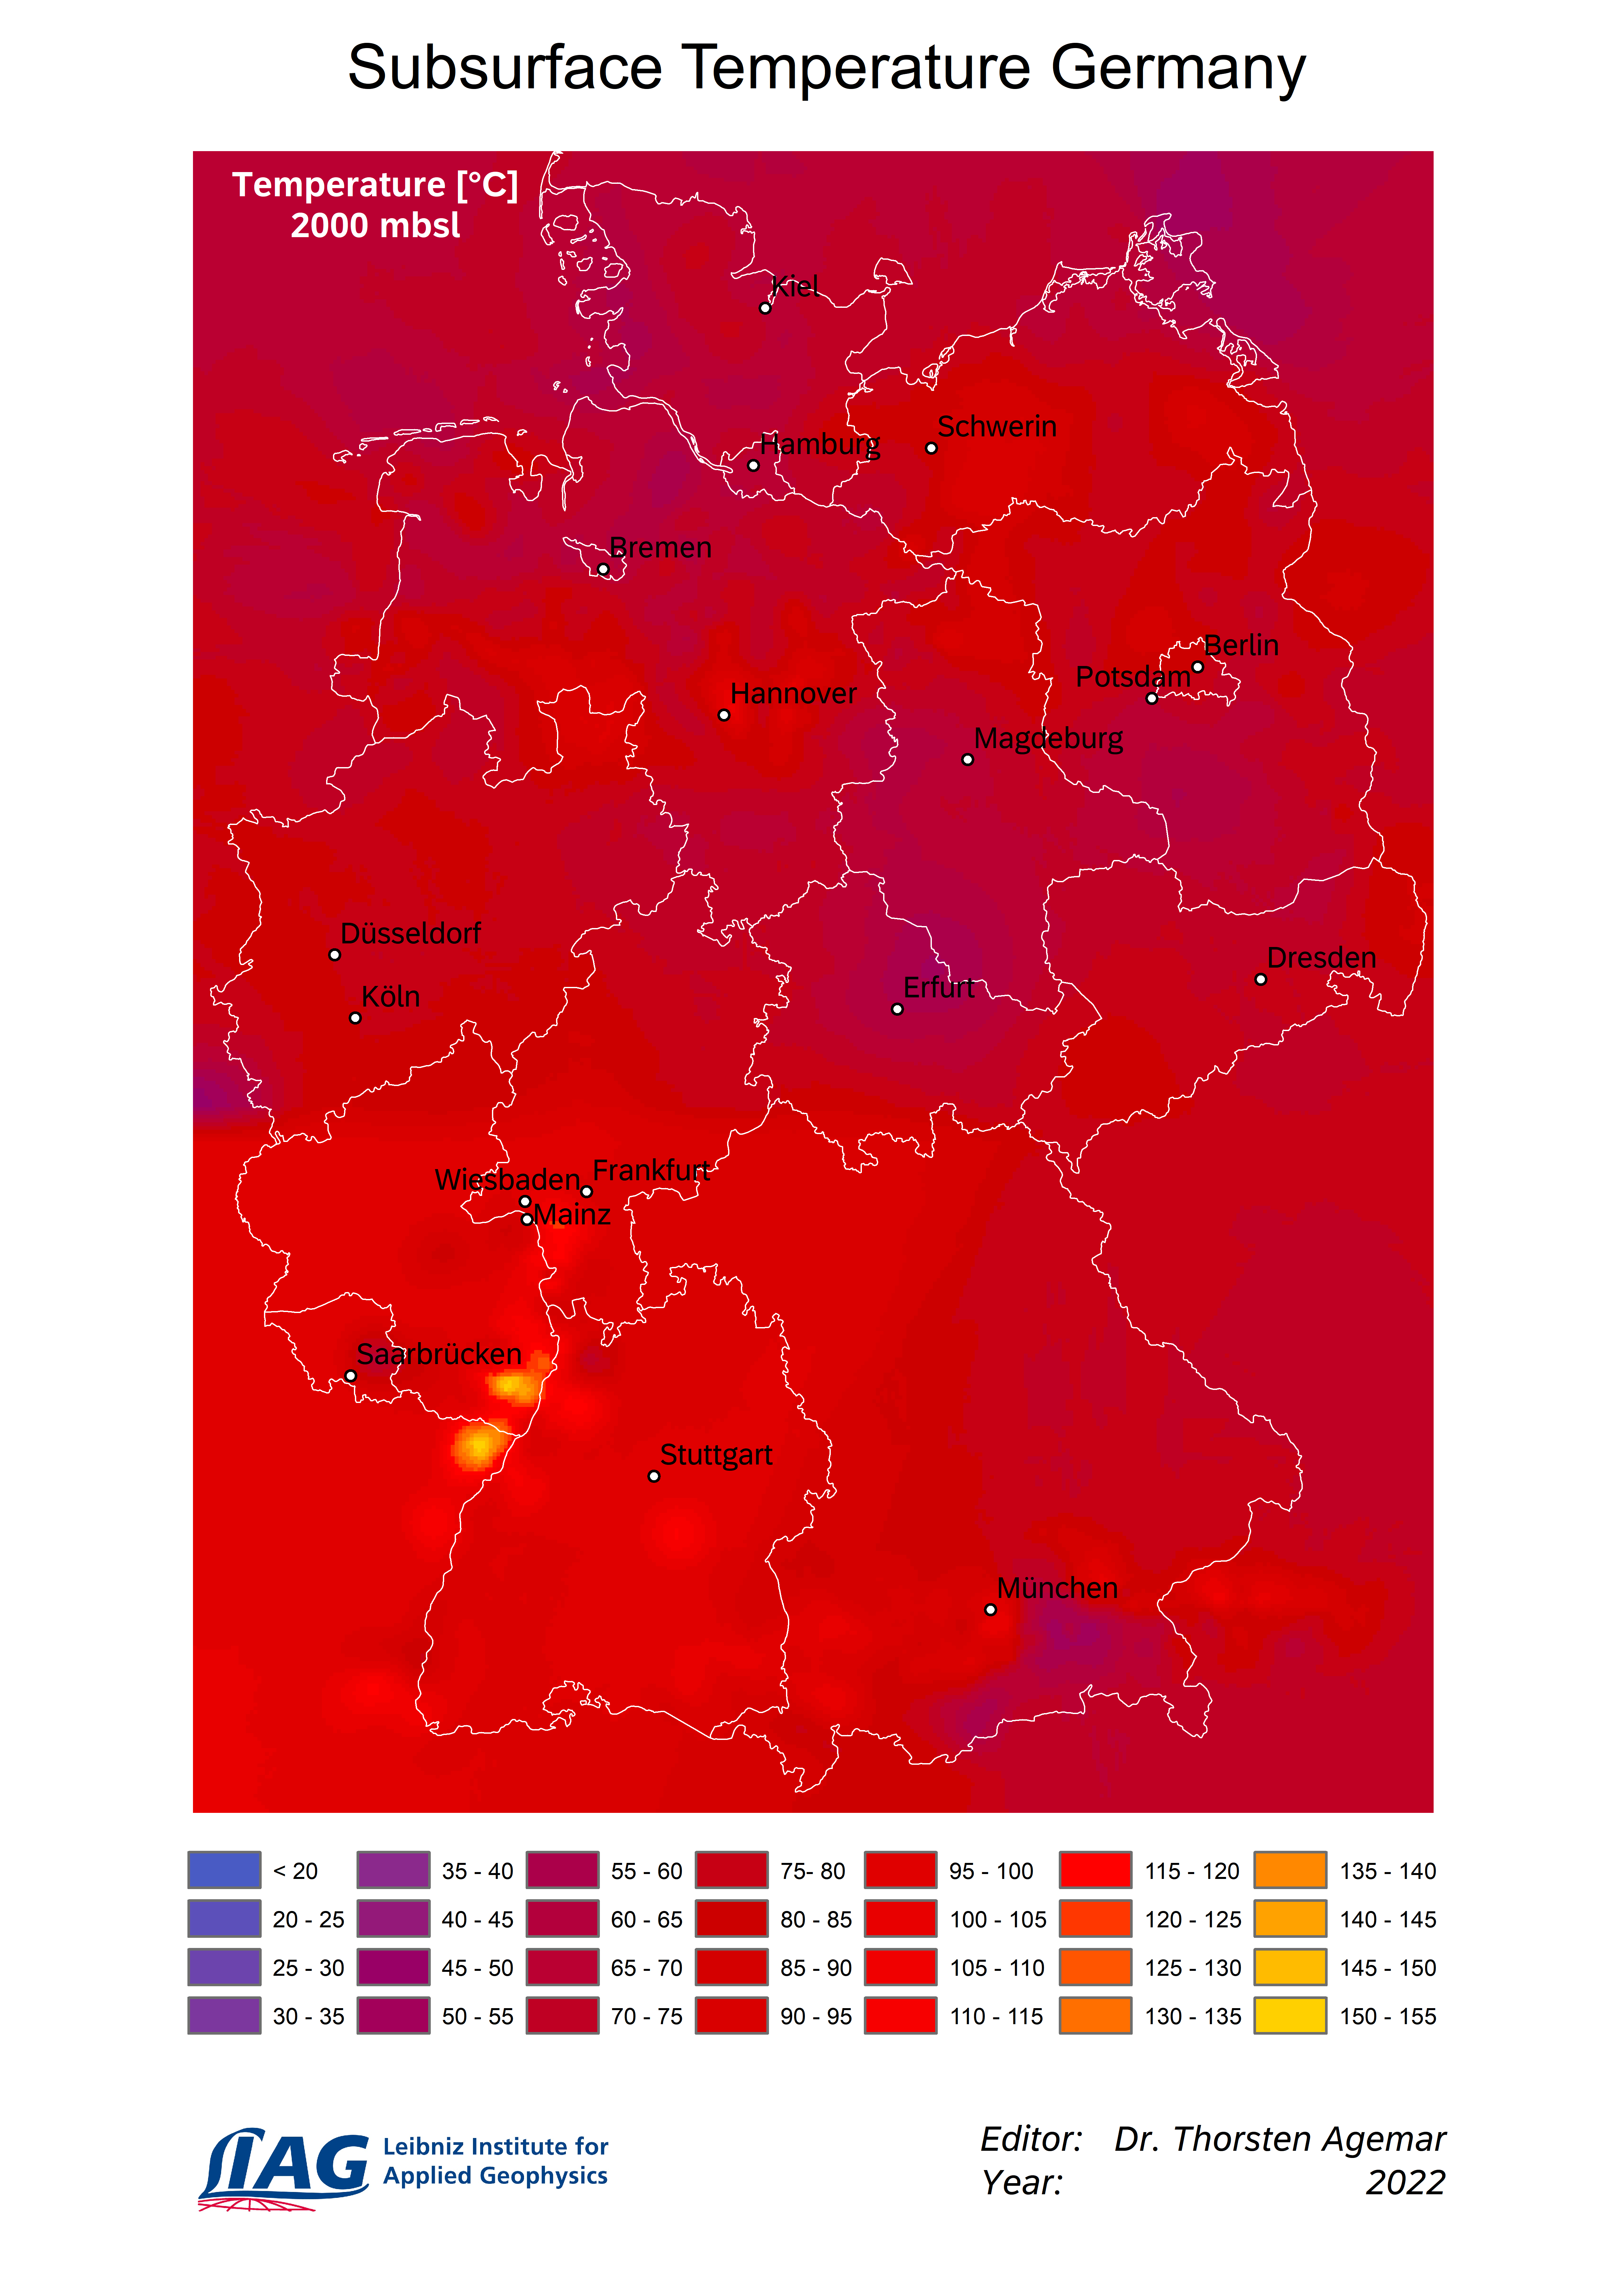
Temperature at -2000m NN
Temperature at -2500m NN
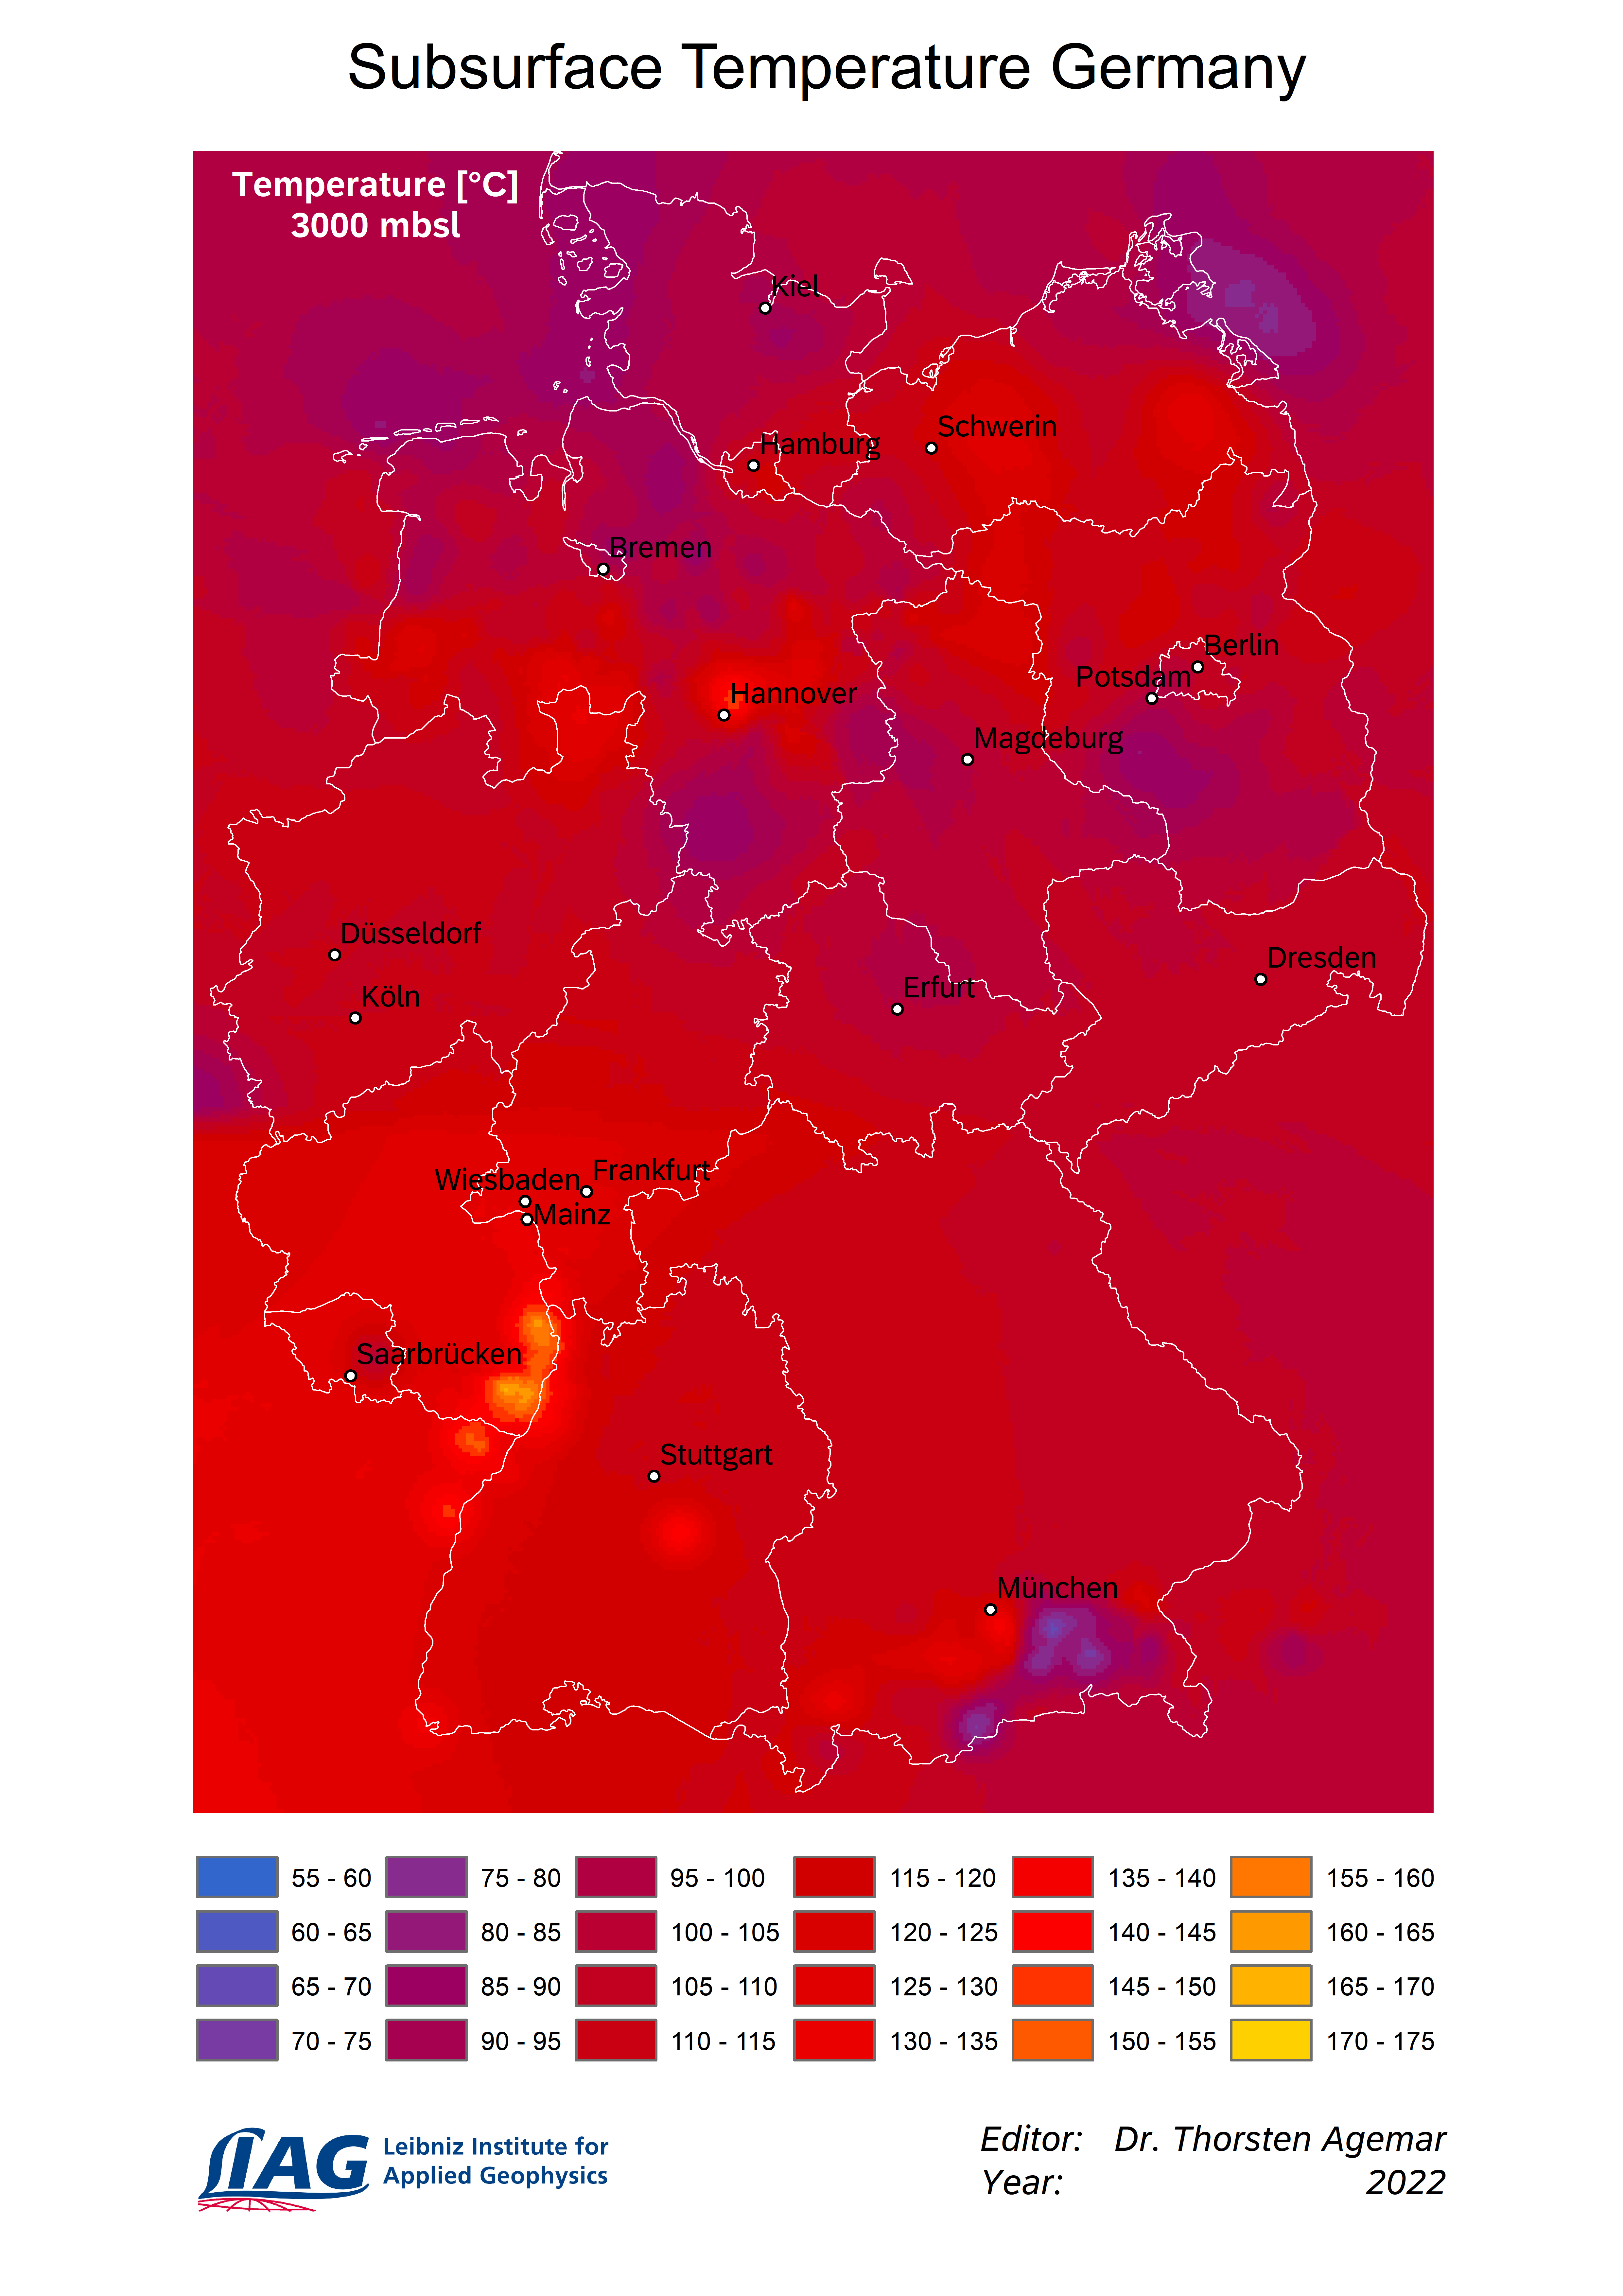
Temperature at -3000m NN
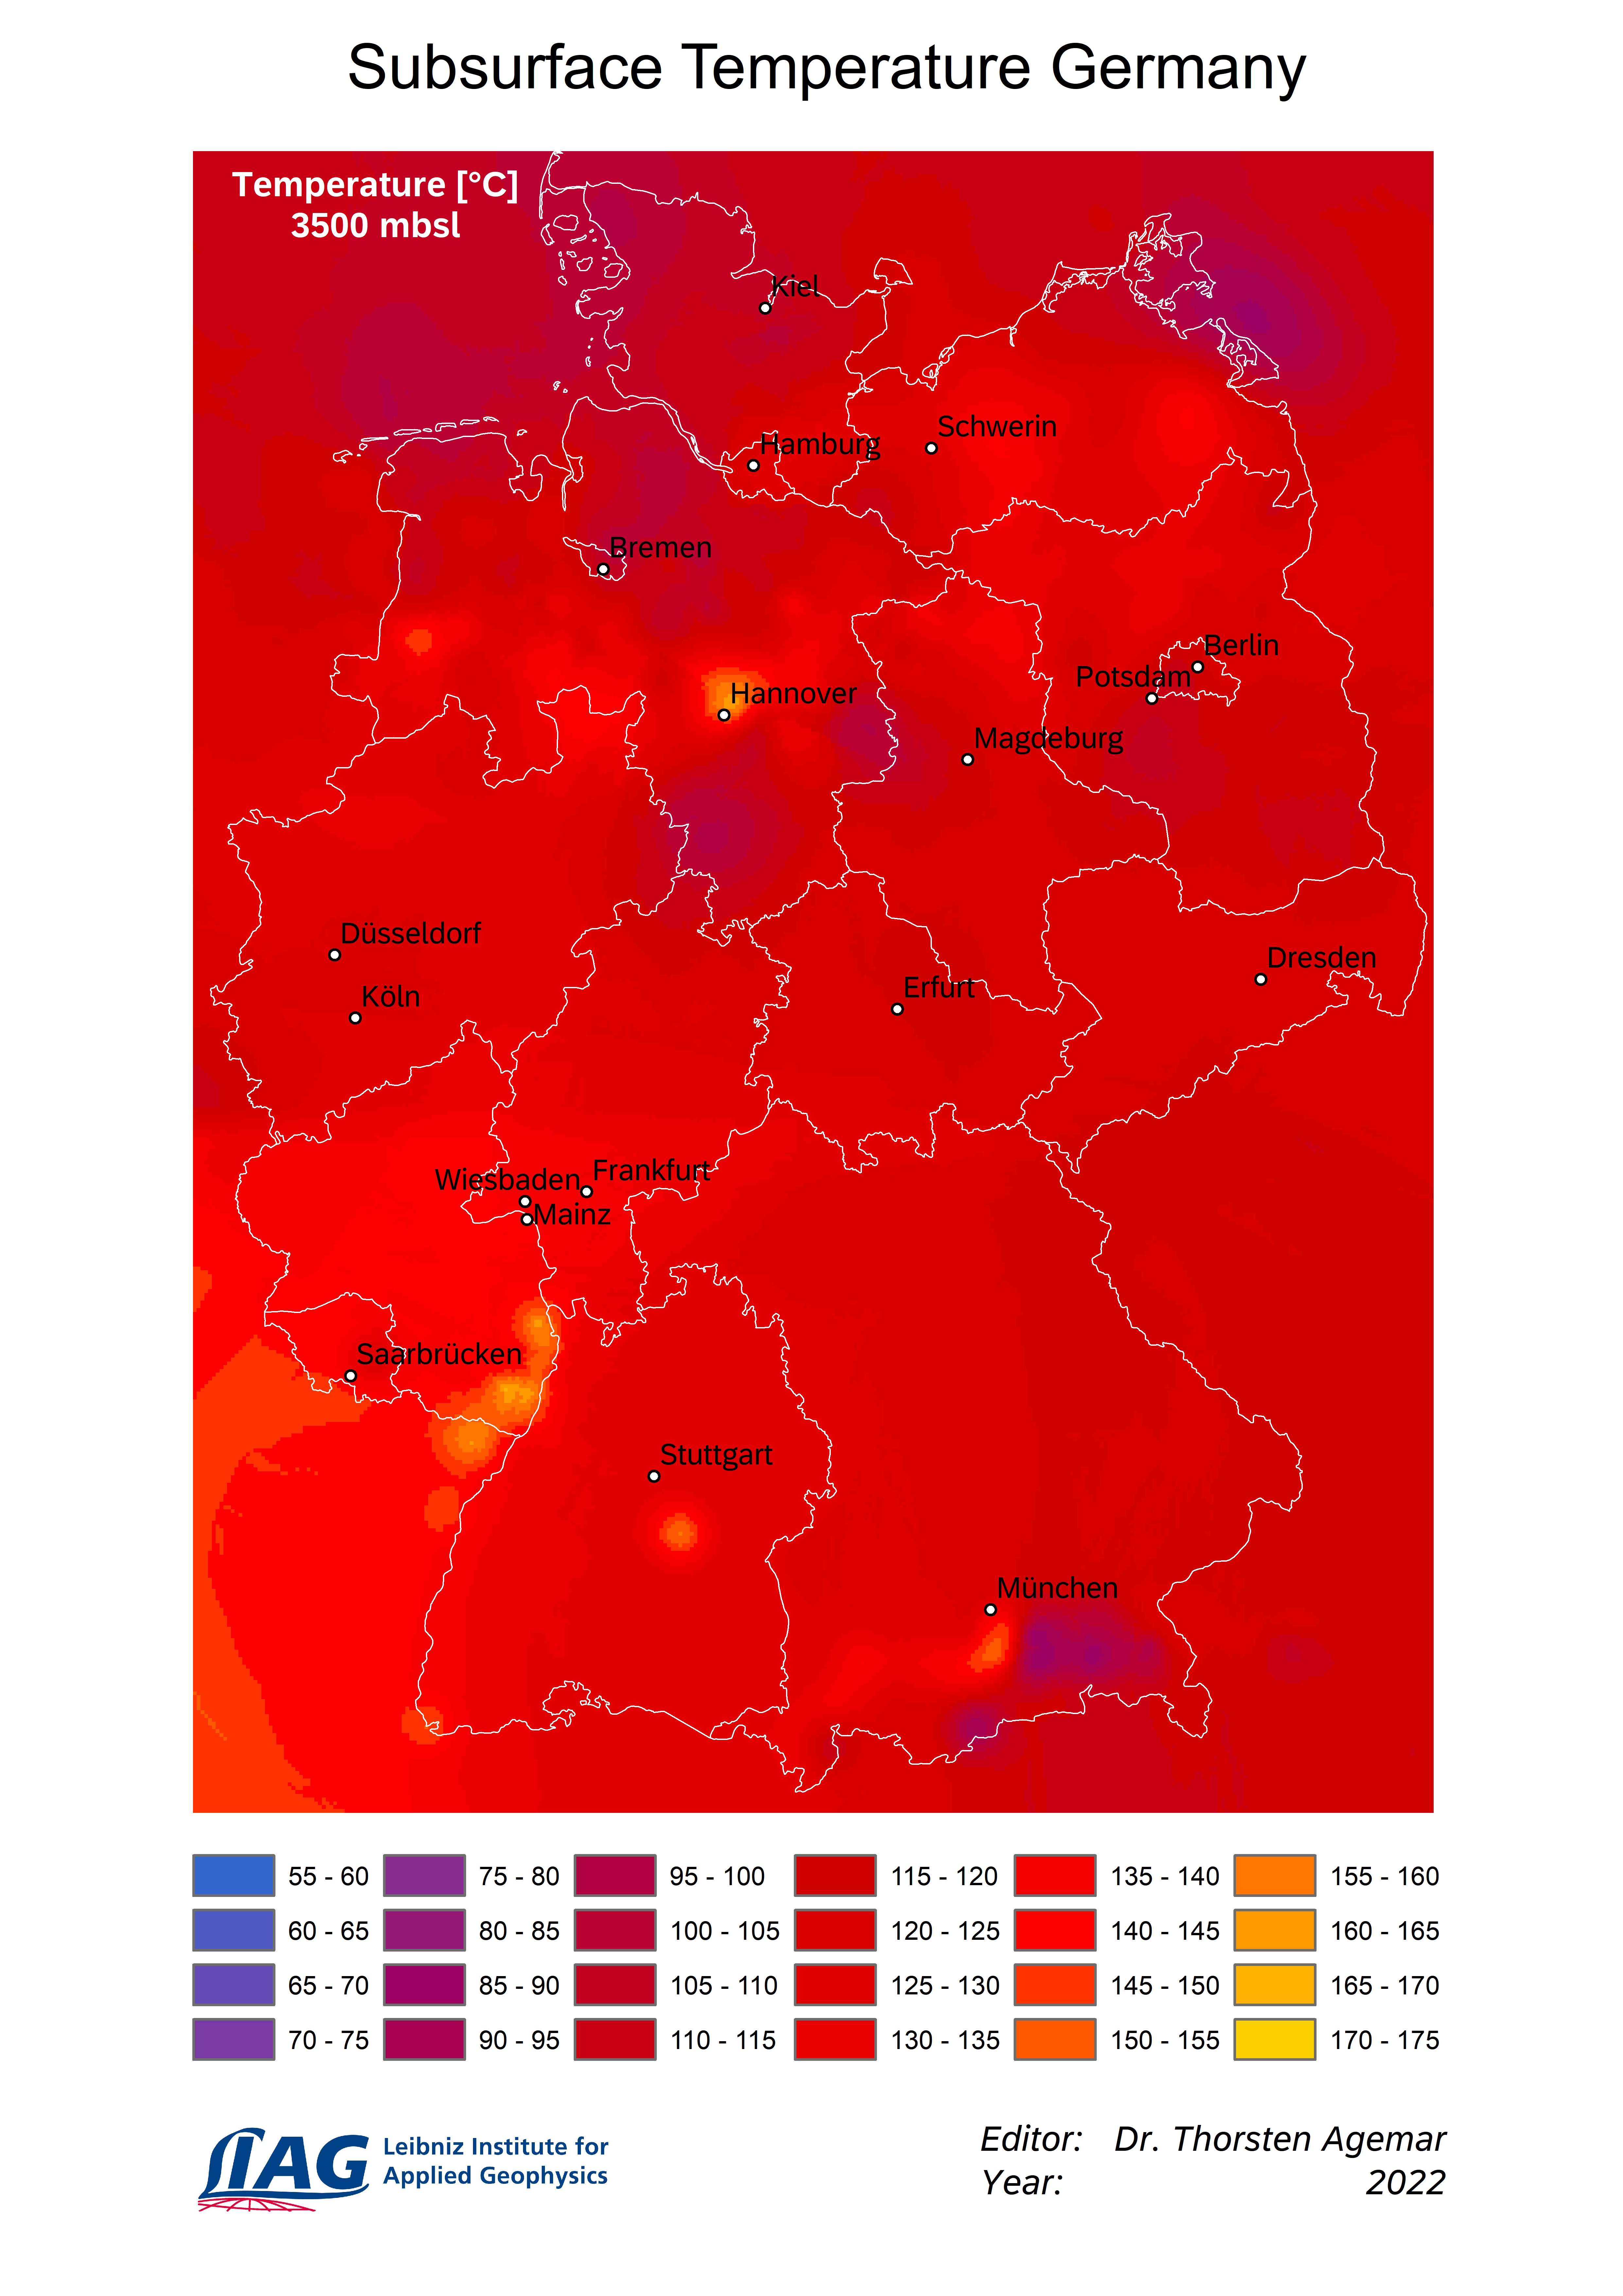
Temperature at -3500m NN
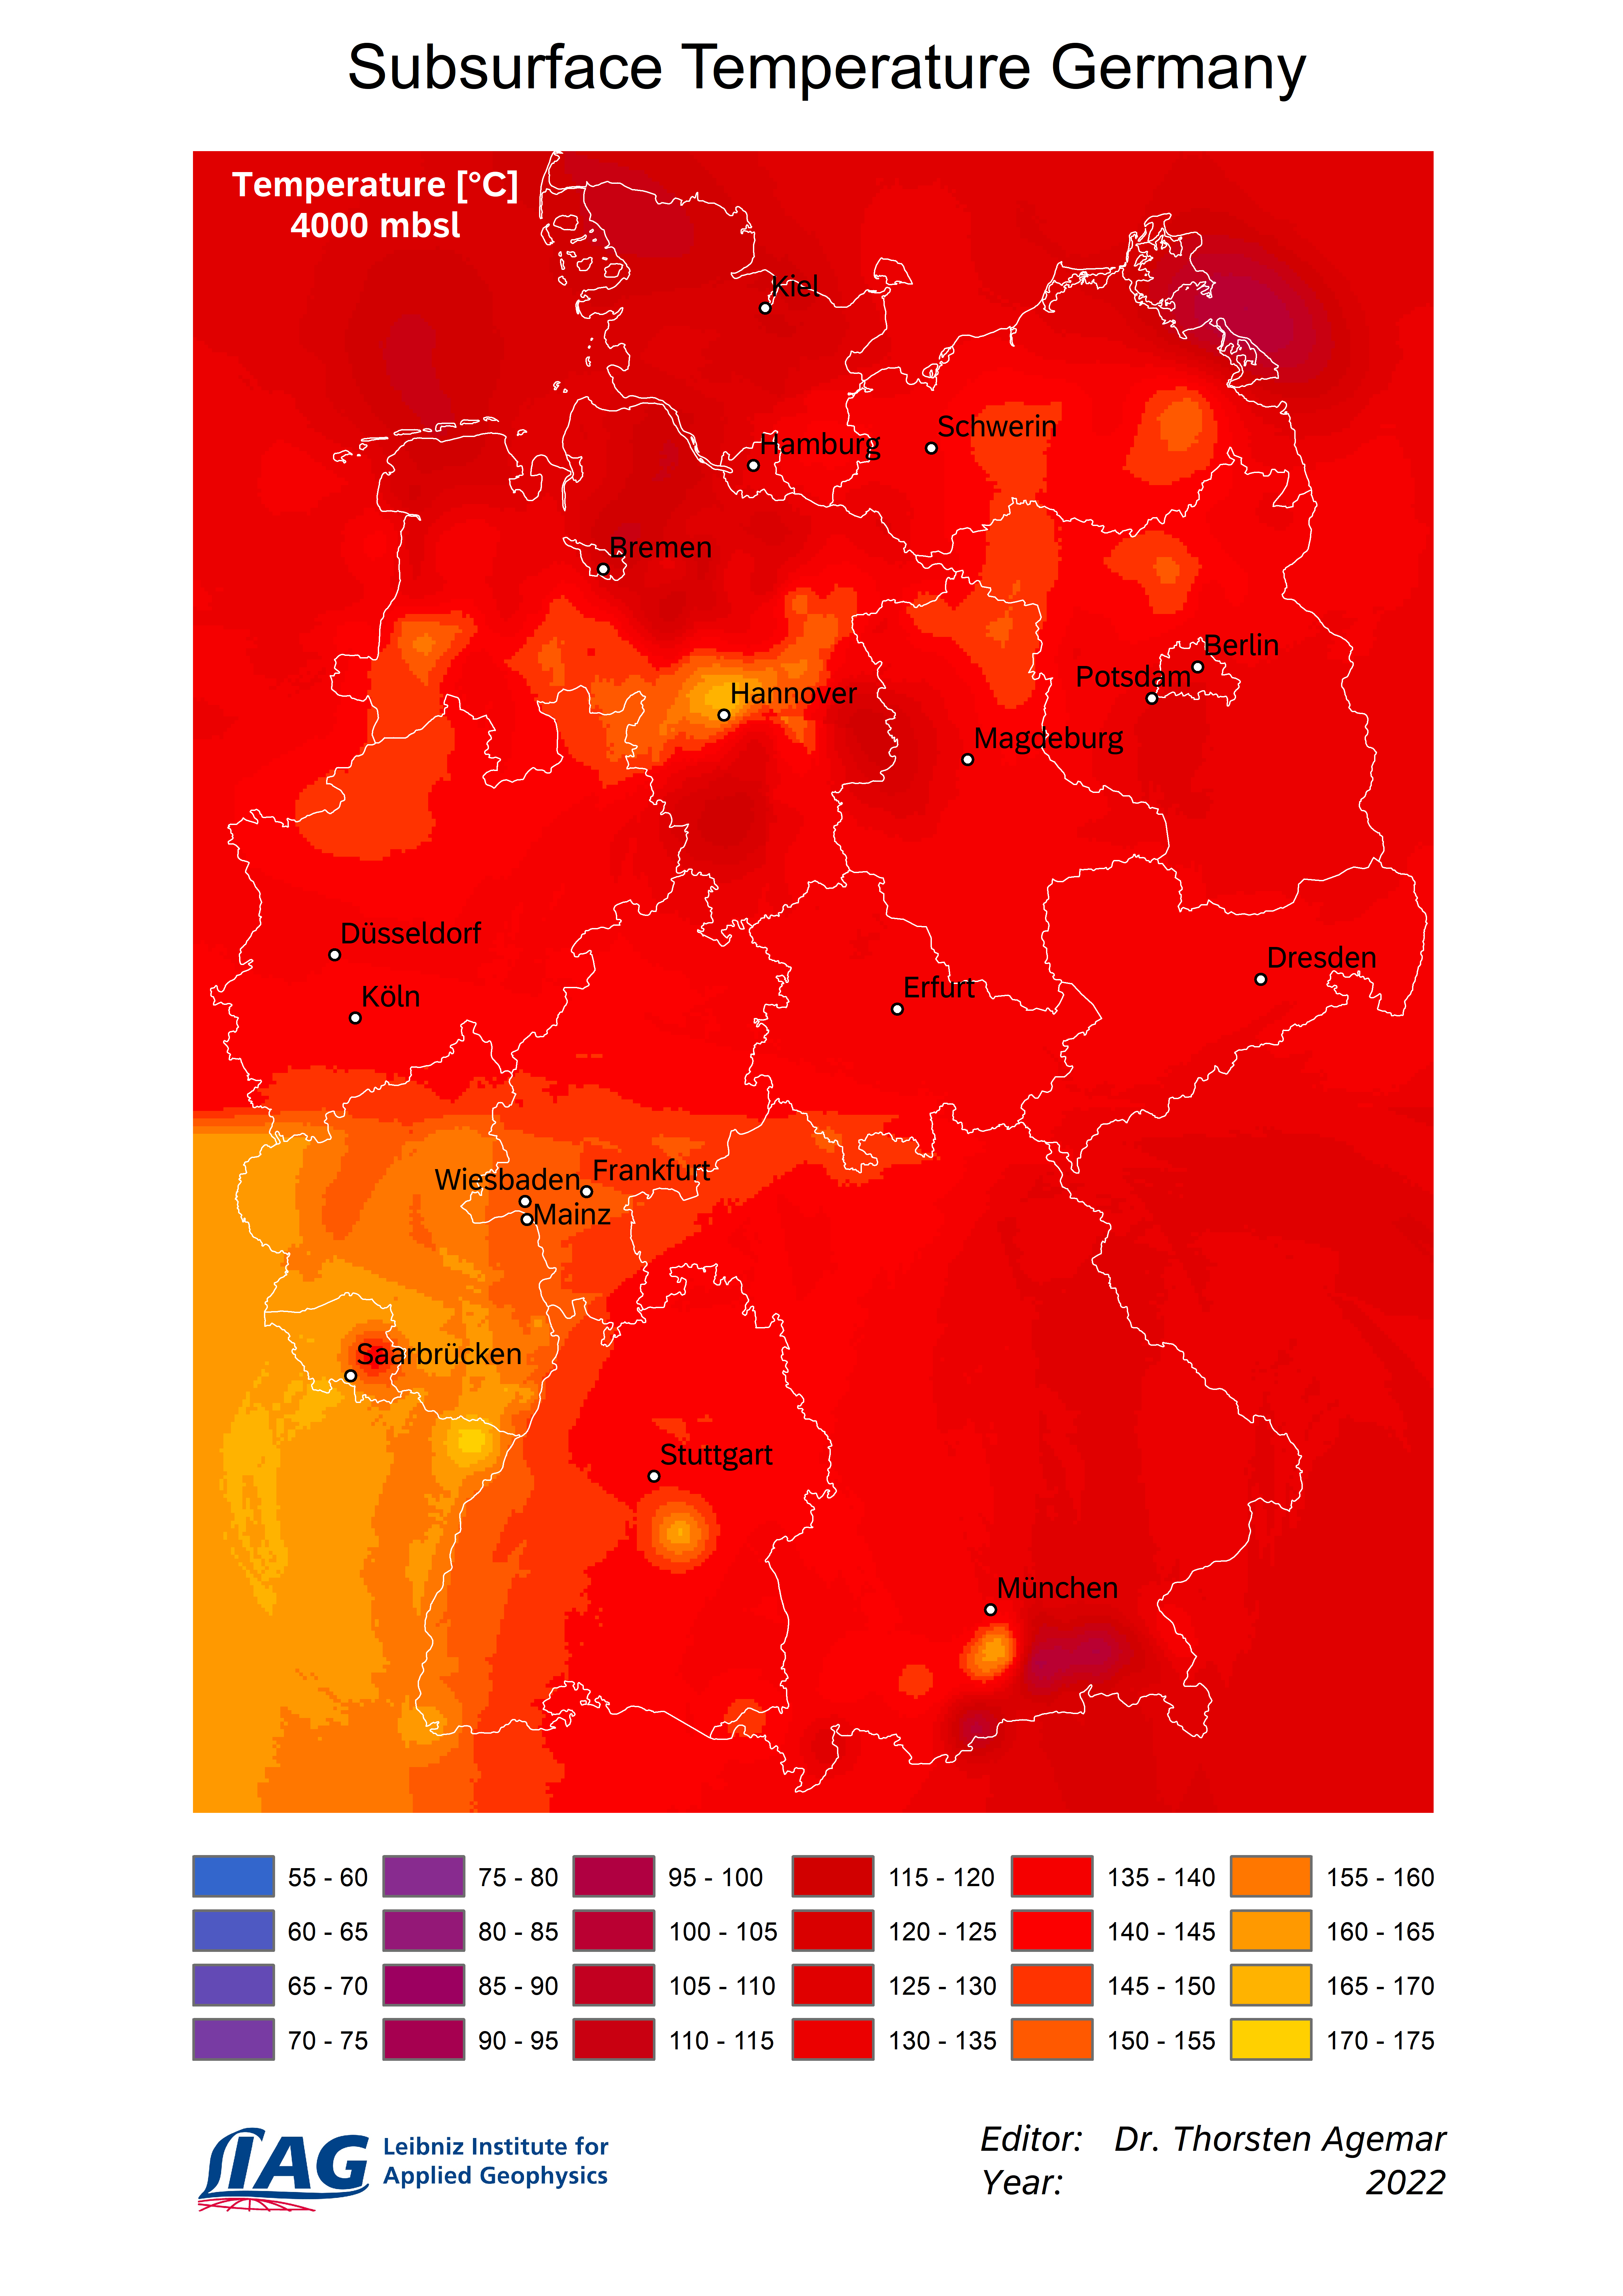
Temperature at-4000m NN
Download all maps:Temperaturkarten.zip
© Agemar, T. (2022)Regional Maps
Subsurface Temperature Maps for the Upper Rhine Graben
Display of the subsurface temperatures for different depths below sea level. Due to the non-uniform data availability, the temperature determined is subject to great uncertainty in some regions. The maps represent an extract from the 3D temperature model of 2022.
Temperature at -1500m NN
Temperature at -3000m NN

Legend
Download all maps:Temperaturkarten_Oberrheingraben.zip
© Agemar, T. (2023)Seismics Upper Rhine Graben
Display of the location of seismic profiles by the hydrocarbon industry in the Upper Rhine Graben in Baden-Württemberg. (JODOCY, M., STOBER, I. (2008))

Hydraulic potentials and the hydraulic conductivities in the Molasse Basin
Distribution map of the hydraulic potentials and the hydraulic conductivities in the Upper Jurassic in the Baden-WÃ1⁄4rttemberg part of the South German Molasse Basin
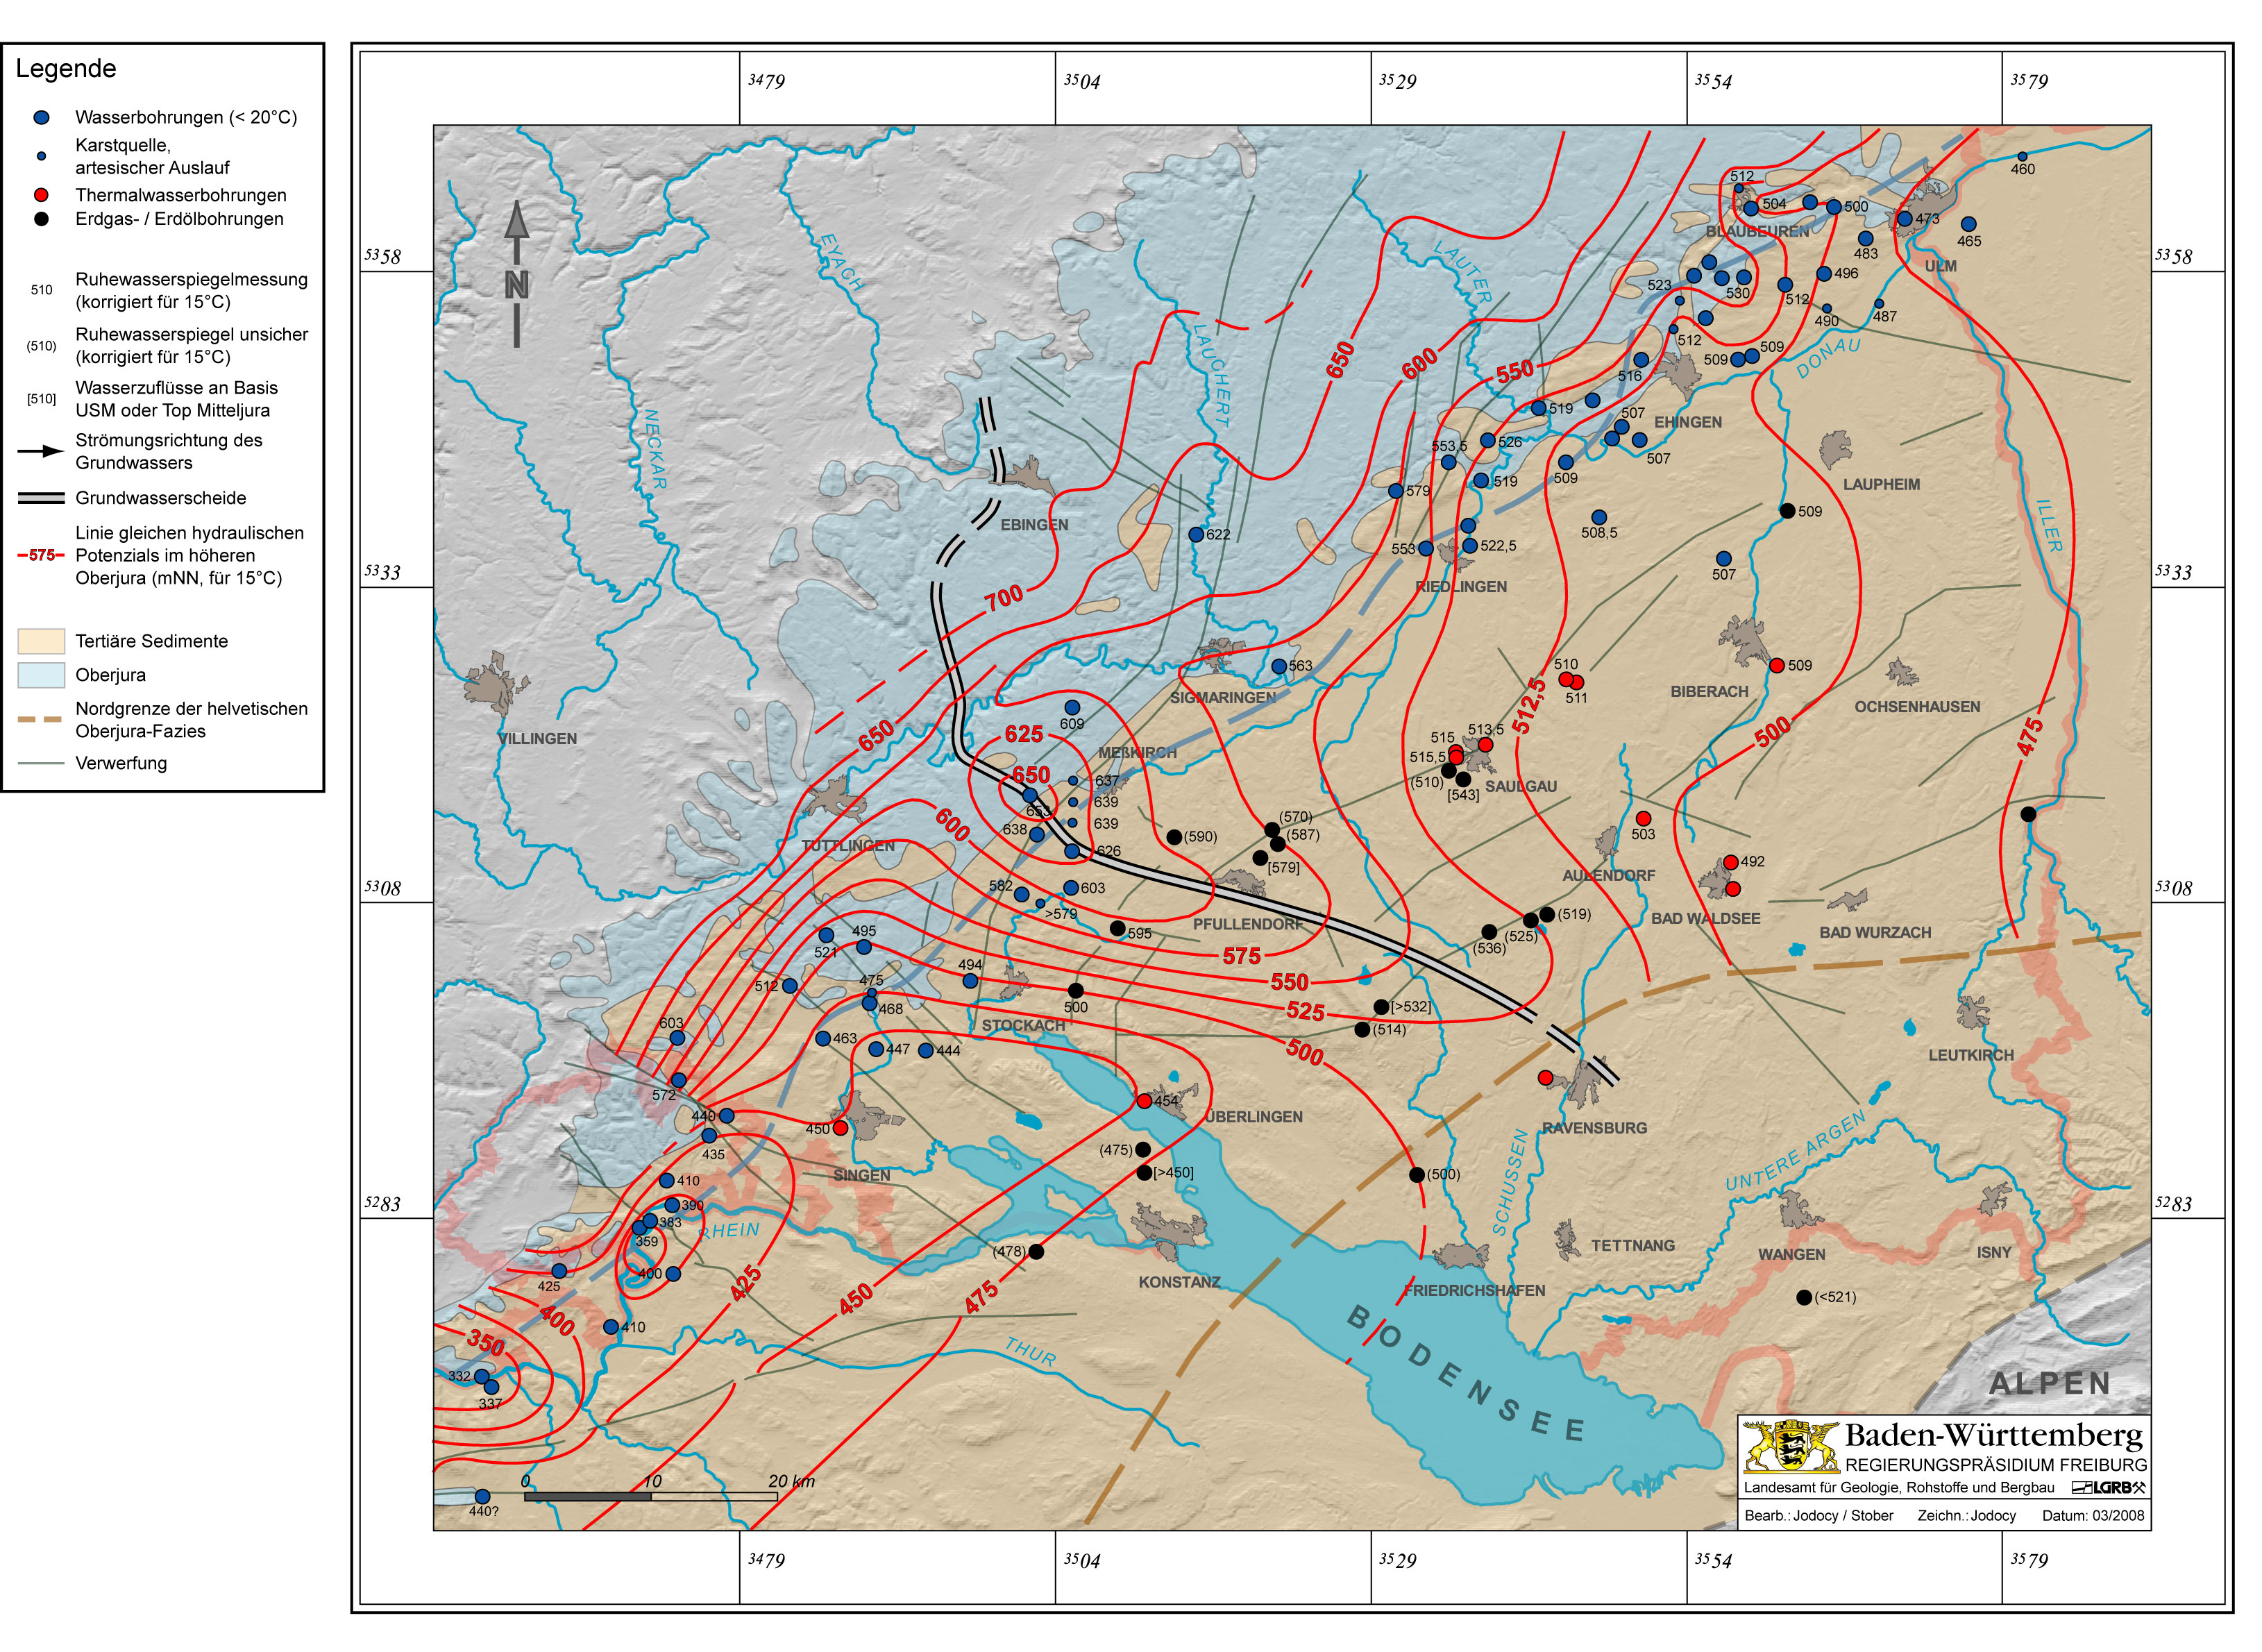
Hydraulic potentials
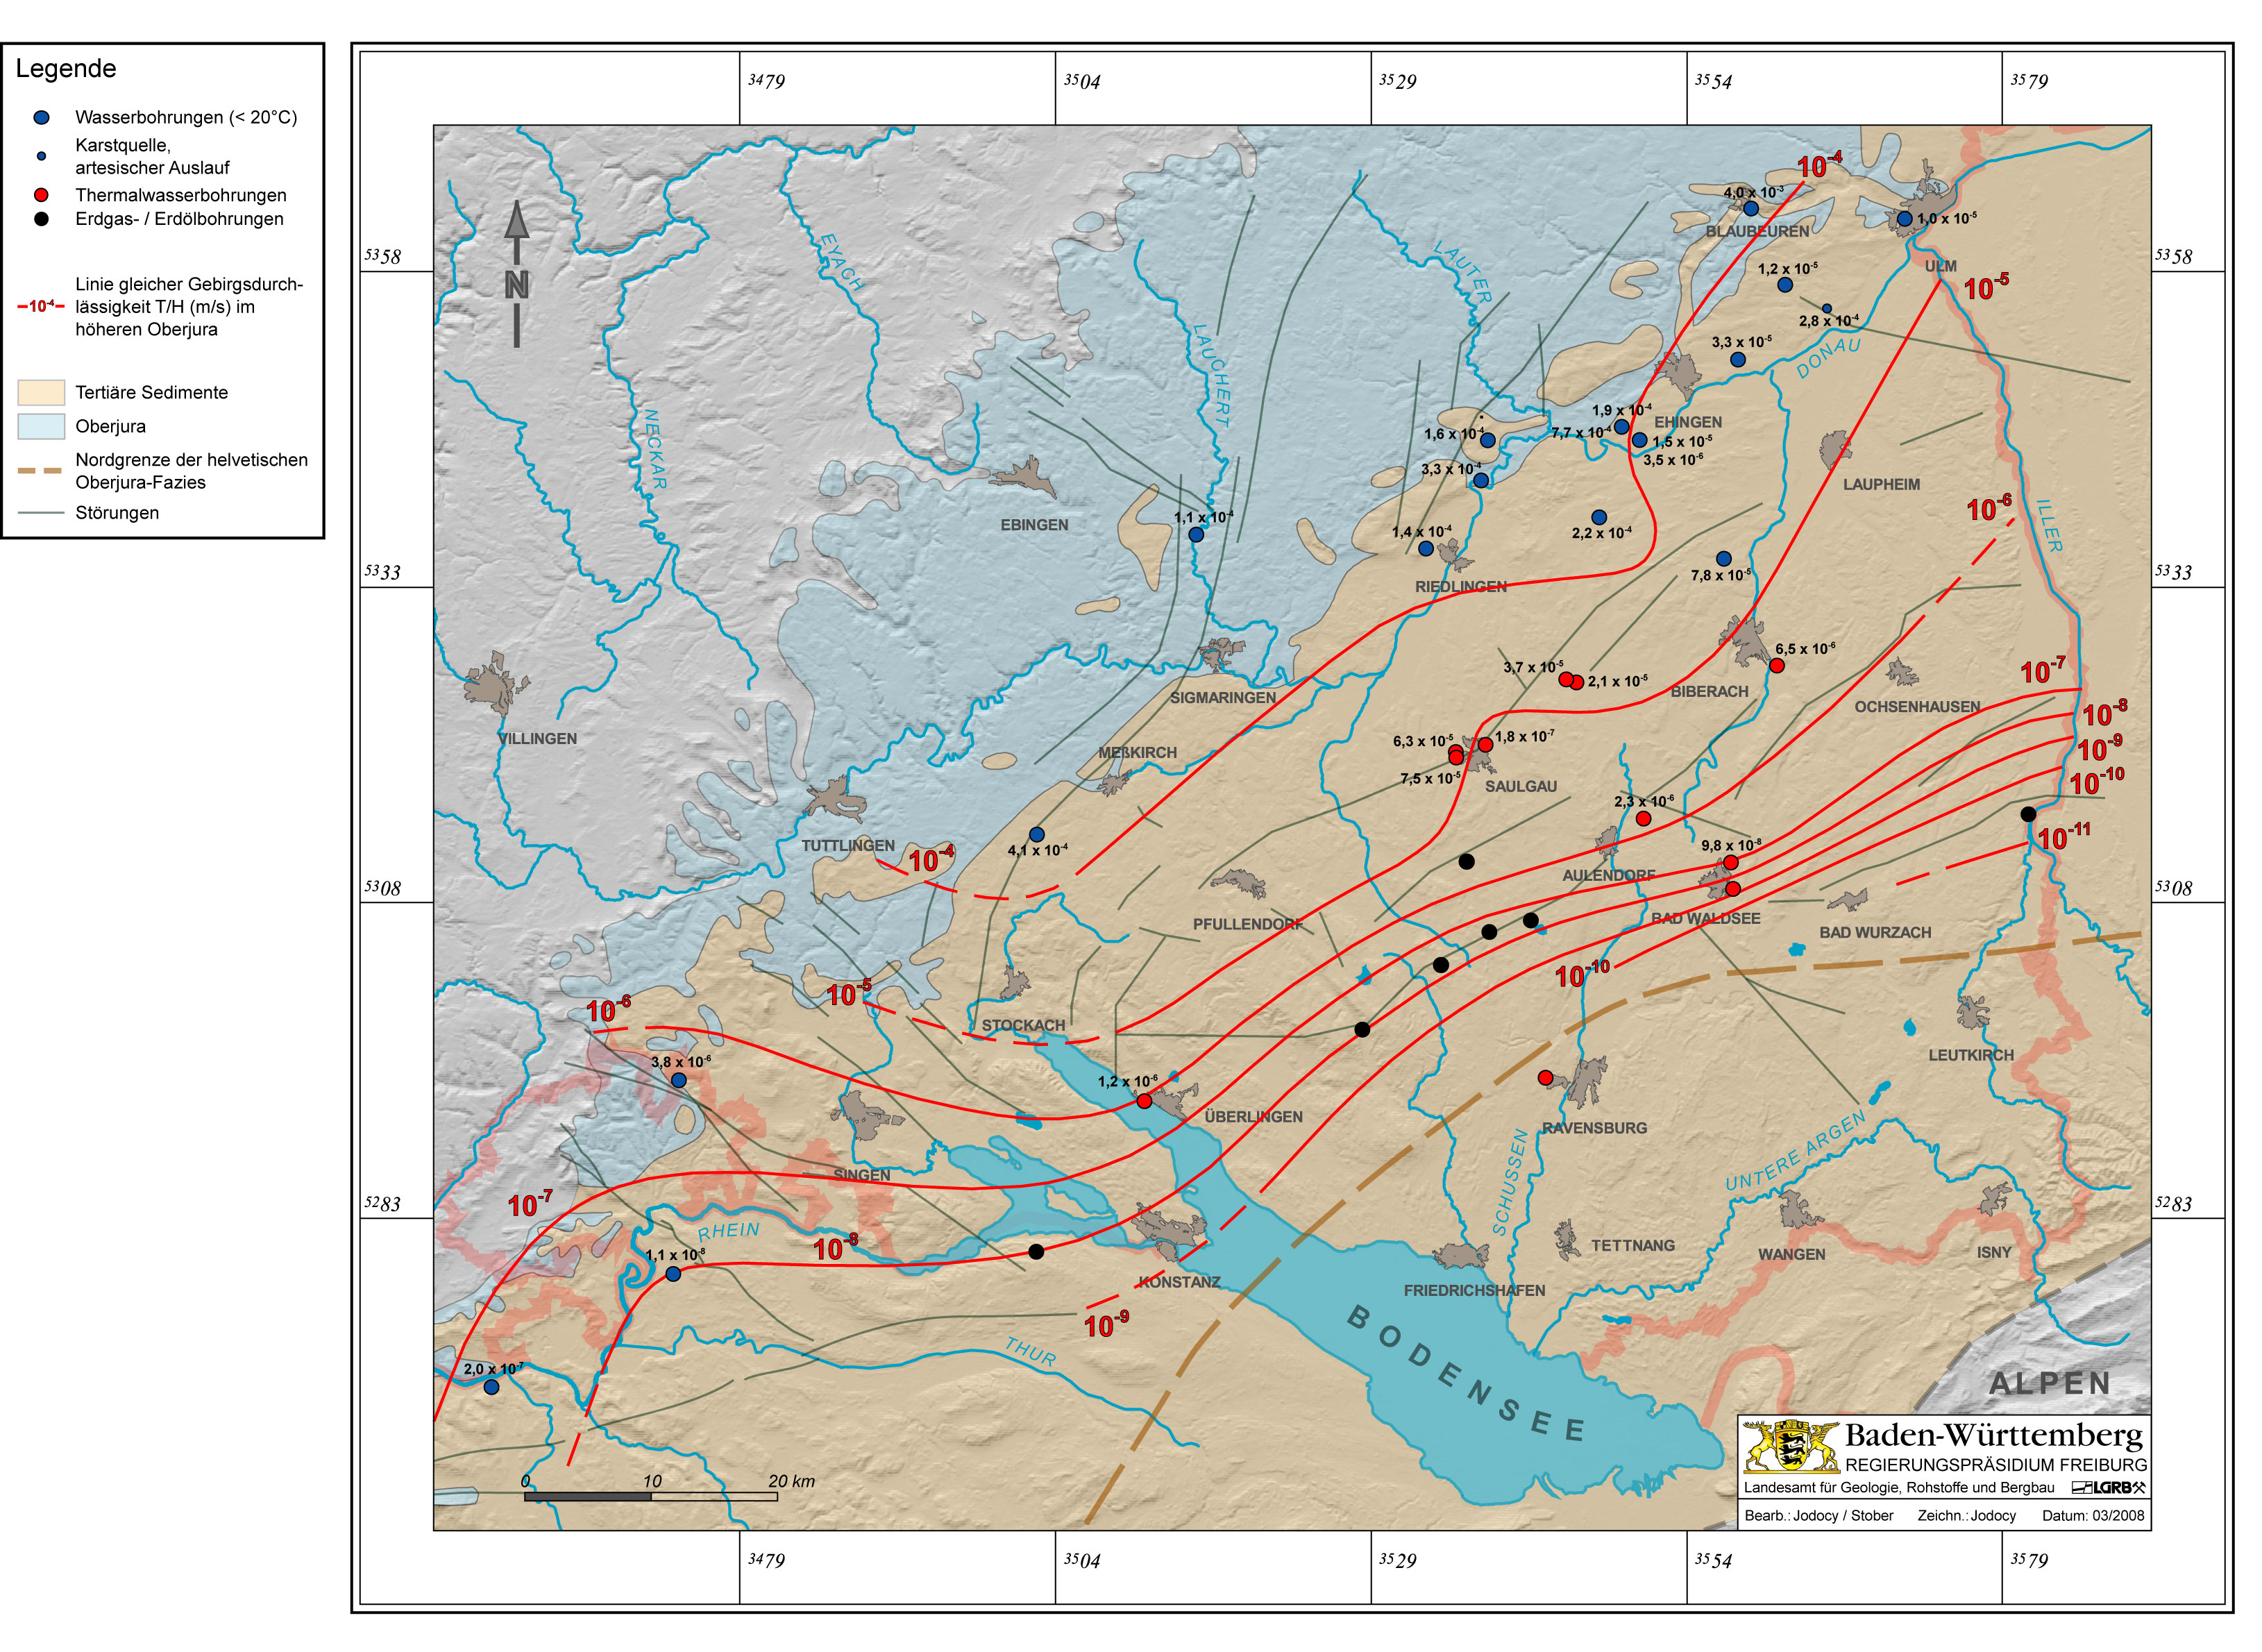
Hydraulic conductivities
